Venture Corp: Forming Double Bottoms

  • Post author:

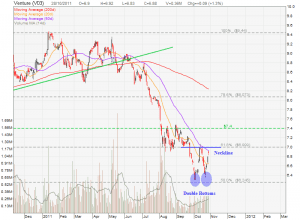
Venture is forming a Double Bottoms chart pattern with neckline at about $7.00. Price Target for this Double Bottom breakout is $7.60.  However, current candlestick pattern does not suggest the breakout soon as a Hanging Man was formed at the 50D MA resistance. If a bearish candle is form in the next trading day, an Evening Start candlestick pattern will be formed indicates a reversal to short term down trend again. Anyway, it is a good pattern to trade on Venture on either direction!

Continue ReadingVenture Corp: Forming Double Bottoms

OCBC Bank: Beware of Reversal!

  • Post author:

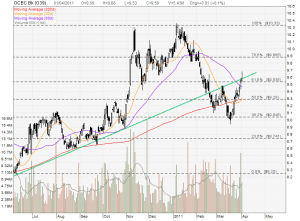
OCBC has been on the uptrend since rebounded from the recent low of about $9.00. OCBC is currently testing the uptrend support turned resistance at about $9.60.  This is also the significant 61.8% Fibonacci Resistance. Last Thursday OCBC ended the day with a Hanging Man candlestick pattern but the stock did not reverse. The stock ended with a Shooting Star pattern on Friday. Both Hanging Man and Shooting Star candlestick patterns are trend reversal pattern. The odd of trend reversal is even higher when these patterns are observed at the resistance level.  If OCBC does reverse the trend, the stock may retrace back to $9.30 which is the 200D MA support and also the 50% Fibonacci Support.

Continue ReadingOCBC Bank: Beware of Reversal!