Capitaland: Big Fund Selling?

  • Post author:

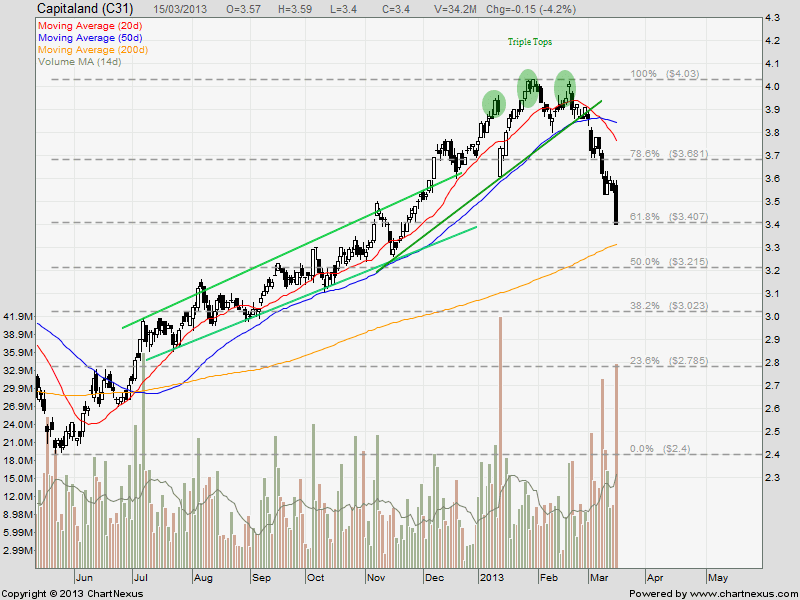
Capitaland broke out from the Triple Tops and reversed to the bearish trend. Capitaland is currently at Elliott Wave A and may be rebound from 61.8% FR (about $3.40) or 200D SMA ($3.30) to form Wave B before continue the down trend.

2013Mar15-Capitaland-800x600

Another interesting observation to note on the Time & Sales after last Friday closing, there was a huge sell down from $3.52 to $3.40 with 16,091 lots transacted. This represent 47% of the whole day transacted volume. Who was selling “desperately” after trading hour? There were similar selling patterns on Wilmar and SIA also, with close to 50% of the whole day trading volume sell down after the market close. It is up to your imagination who are the BIG SELLERS but this type of selling is definitely not a good sign.

Capitaland_Mar15-2013_BigFundOffloading

Last Analysis on Capitaland.

Continue ReadingCapitaland: Big Fund Selling?

Bank of America (BAC): Beware Triple Tops!

  • Post author:

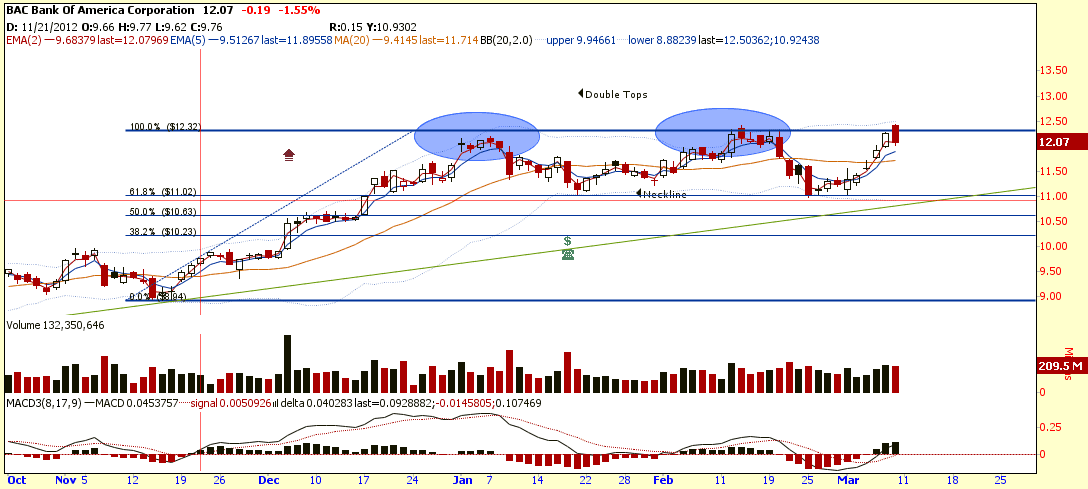
BAC formed a Dark Cloud Cover reversal candlestick pattern at the resistance and have a potential of forming a Triple Tops pattern. I moved my stop loss just below $12.00 psychological support to protect my profit.

Possible Scenarios & Trading Plan:

  • If BAC can stay above the $12.00 support, I will stick to my trading plan to let BAC to head towards $14.40 (161.8% FR). I will continue to move my stop loss upward to protect the profit.
  • If BAC breaks $12.00 support, I will be stopped out. The next plan is to wait for BAC to retrace back to the neckline of $11.00 (also the uptrend channel support – marked in green) and see whether this support can be hold. If there is reversal pattern at $11.00, I will long BAC again. If the $11.00 support is broken, there will be a breakout of Triple Tops chart pattern with price target below $10.00.  I may consider to short BAC using Put option.

See previous BAC analysis and chart pattern with different time scale here.

BAC Mar10-2013

Continue ReadingBank of America (BAC): Beware Triple Tops!

Keppel Land: Triple Tops

  • Post author:

Keppel Land has formed a Triple Tops and looks like reversing the trend. Currently Keppel Land is just at the 50D SMA support. The bear will be awaken if this support is broken.

2013Mar1-KeppelLand

Key Statistics for KPLD

Current P/E Ratio (ttm) 7.4281
Estimated P/E(12/2013) 15.7634
Relative P/E vs. FSSTI 0.7012
Earnings Per Share (SGD) (ttm) 0.5560
Est. EPS (SGD) (12/2013) 0.2620
Est. PEG Ratio 1.2743
Market Cap (M SGD) 6,378.70
Shares Outstanding (M) 1,544.48
30 Day Average Volume 2,511,067
Price/Book (mrq) 1.0339
Price/Sale (ttm) 6.6267
Dividend Indicated Gross Yield 2.91%
Cash Dividend (SGD) 0.1200
Last Dividend 04/23/2013
5 Year Dividend Growth 36.19%
Next Earnings Announcement 04/18/2013
Continue ReadingKeppel Land: Triple Tops