
See previous week Weekly Inter Market Analysis.
Original post from https://mystocksinvesting.com
SPY (SPDR S&P500 ETF)
SPY is getting near to the resistance of the historical high. All eyes to see whether this resistance can be broken for the new high of 219.31. Take note that the bullish between Nov to April seasonal cycle is going to start.
- Historical high resistance: about 219-220.
- Resistance turned support zone: 211-213.
- Rising Wedge immediate support: about 210.
- 200D SMA support (trending up): about 210

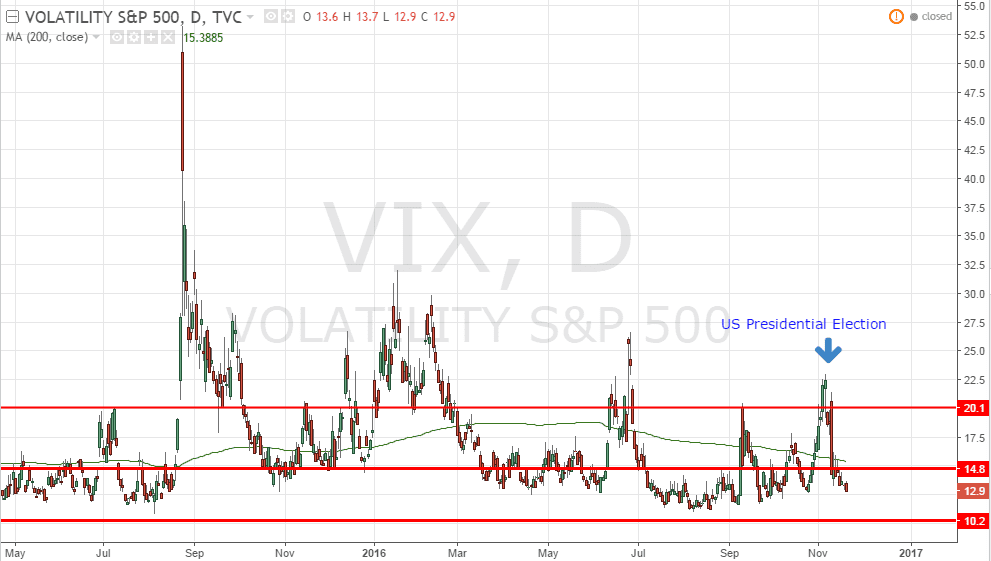
VIX
VIX dropped back to complacent zone. No fear!
Sector Performance (SPDR Sector ETF)
- Best Sectors: Energy (XLE) +2.40% & Financial (XLF^) +2.26% respectively
- Worst Sector: Healthcare (XLV) -1.12% and Consumer Staples (XLP) -0.08%
- Comment: This is RISK ON combination of aggressive sectors like Financial, Industrial & Technolgy show bullishness but defensive sectors like Utilities, Healthcare and Consumer Staples are lagging.

SUDX (S&P US Dollar Futures Index)
SUDX broke out from the uptrend channel and is currently testing Mar high of about 134.45 with a shooting star candlestick pattern. It may retrace if next candle is a long bearish candle.

FXE (Currency Shares Euro ETF)
FXE broke the support zone and continued the sell off. Currently FXE is testing another critical support at about 102.94.

XLE (SPDR Energy Sector ETF)
Although XLE is still trading within the up trend channel, XLE is forming a multiple tops. Keep an eye on the current channel support and 200D SMA support. Breaking these supports will turn XLE into bearish mode. If XLE breaks the current resistance level, expect a strong bull run for XLE.

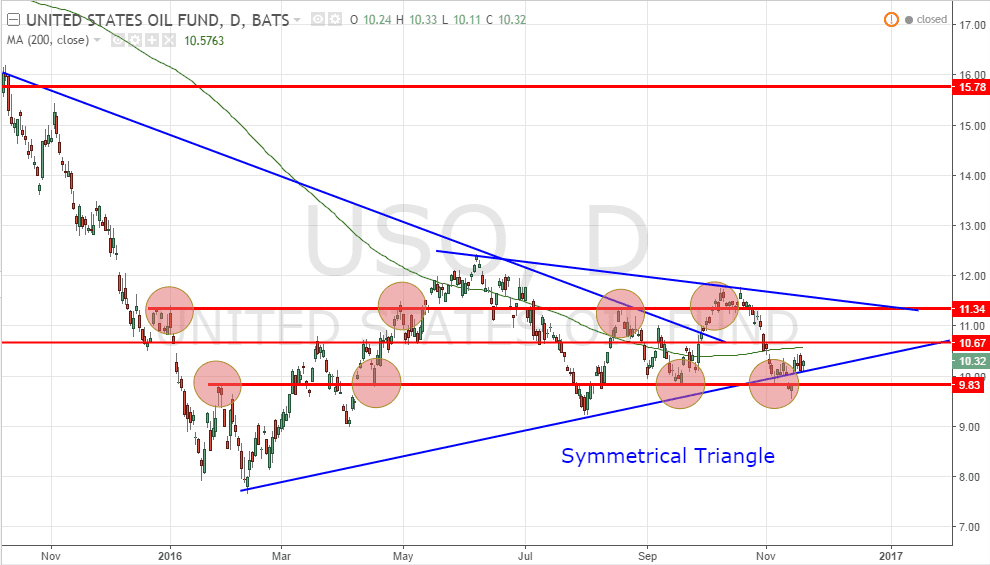
USO (United States Oil Fund)
USO rebounded from 9.83 support. Expect USO to trade within range between 11.34 and 9.83 until breakout to either direction.
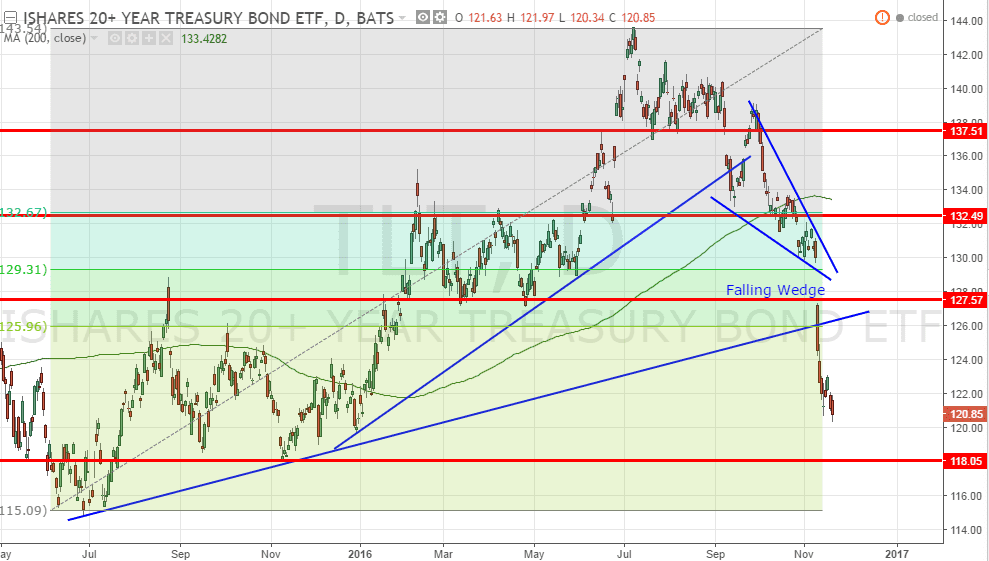
TLT (iShares 20+ Years Treasury Bond ETF)
TLT broke down from a Falling Wedge. Huge sell off in Treasury Bond continues. Next support at about 118. Now Equity and Bond is the “normal” inversion relationship again. Equity rallies, bond sells off –> This is a RISK ON scenario.
GLD (SPDR Gold Shares)
GLD is currently testing 115 support. This is also the 50% Fibonacci Retracement Level. Take note GLD is on down trend after forming a “Lower Low, Lower High” Bearish chart pattern.

Next Week Economic Calendar
Key events:
- ECB President Draghi speaks on Nov 22 (Tuesday)
- Crude Oil Inventory on Nov 24 (Thursday)
- US Unemployment Claim on Nov 23 (Wednesday)
- FOMC Meeting Minutes on Nov 24 (Thursday)

See upcoming Events here. https://mystocksinvesting.com/events/