Singapore REIT Fundamental Analysis Comparison Table – 4 Jan 2015
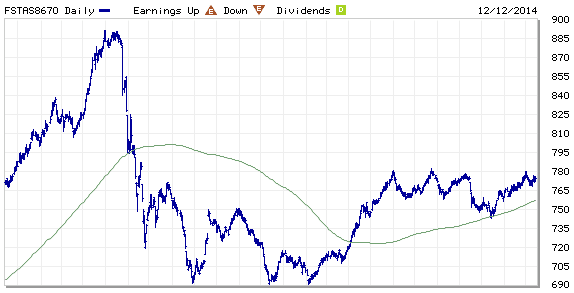
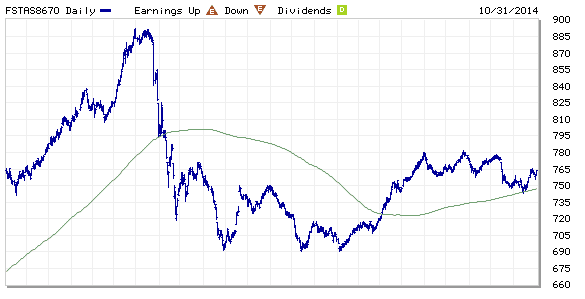
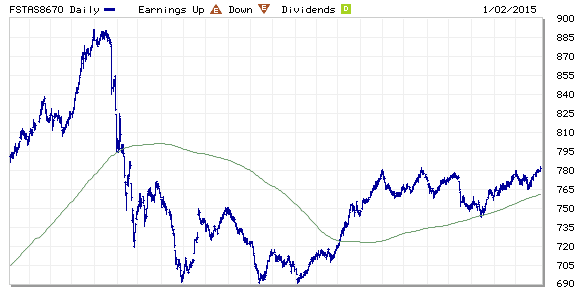
FTSE ST Real Estate Investment Trusts (FTSE ST REIT) Index changes from 774.40 to 781.16 compare to last post on Singapore REIT Fundamental Comparison Table on Dec 14, 2014. The index is currently testing the 52 weeks high resistance. Long term trend for Singapore REIT is bullish base on the chart pattern of this ST REIT index as the 200D SMA is trending up. The index is currently range bound in consolidation mode and moving sideway until there is a breakout.
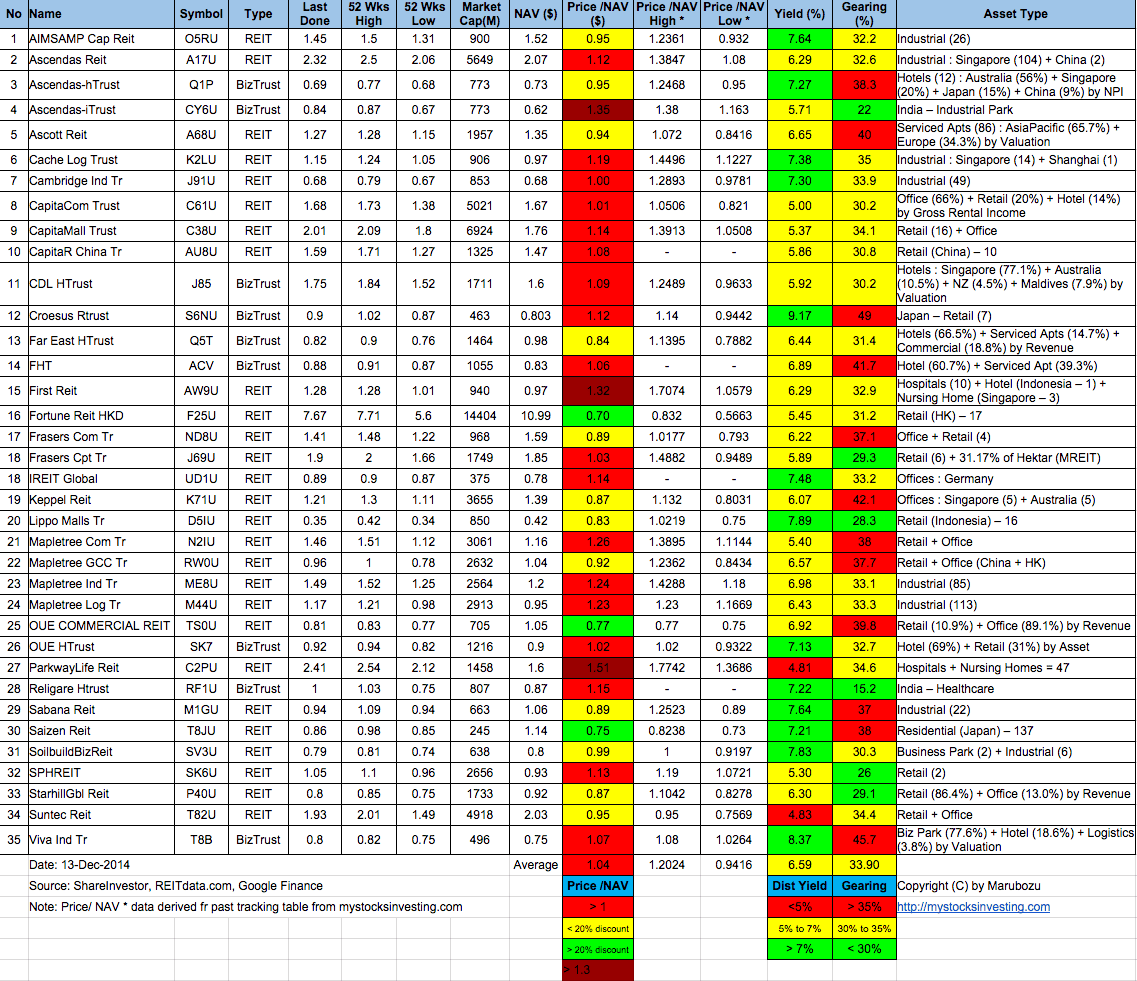
- Added Keppel DC REIT and updated Price/NAV high and low for some REITs.
- Price/NAV no change at 1.04 (slightly over value now)
- Distribution Yield decreases slightly from 6.59% to 6.57% (take note that this is lagging number, past DPU does not represent future DPU). Note: I did not color code the yield number because yield is relative to individual risk appetite. High Yield does NOT mean it is a good REIT. Low Yield does NOT mean it is a bad REIT. We have to analyse the Fundamental and do Risk Assessment of the REIT.
- Gearing Ratio decreases slightly from 33.90% to 33.74%..

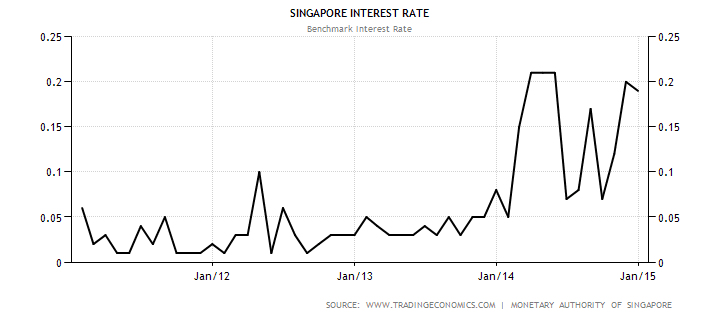
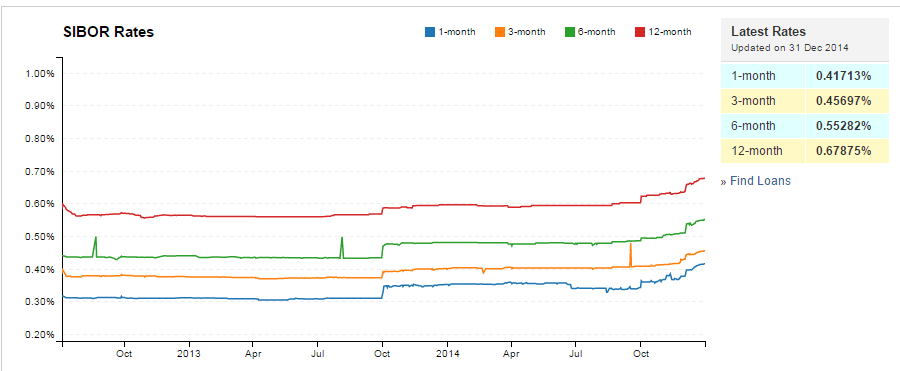
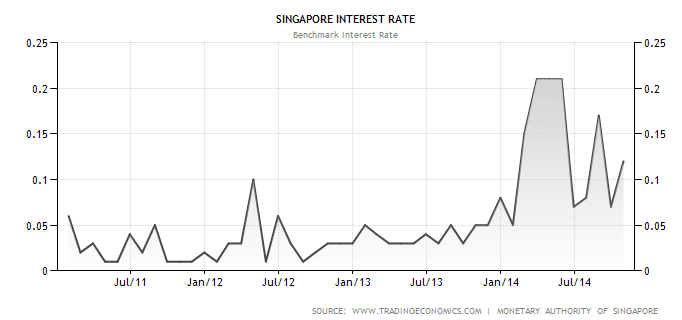
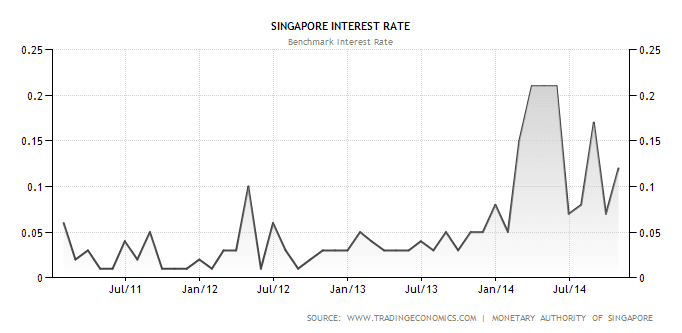
Keep a close eye on Singapore Interest Rate and SIBOR which is increasing quietly.
There are 37 Real Estate Investment Trust in Singapore as shown in the above table. Most people just purely choose the REIT with HIGH DIVIDEND and invest blindly without knowing what are the RISKS. If you want to learn how to pick the right REIT and invest to generate passive income safely, check out the very pragmatic and educational public seminar here “Investing in Singapore REIT“.
Grab an insight of the REIT class here 3 Tips To Increasing Returns On REITs Investments