Singapore Retail REITs: Comparing the Opportunities, Valuations and Key Risks
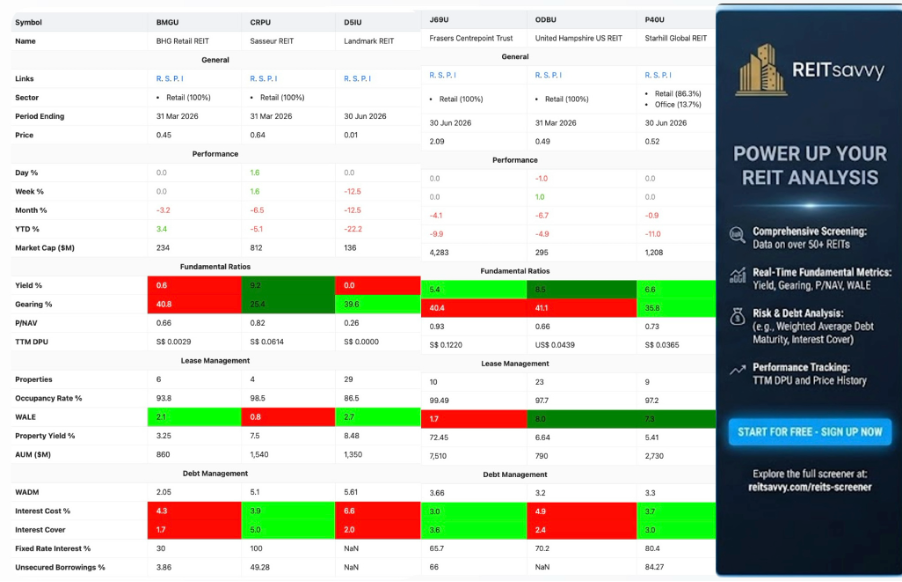
Singapore’s retail REIT sector presents a range of investment profiles, from high-yielding counters trading below NAV to larger, highly occupied portfolios with more moderate yields. The six REITs examined — BHG Retail REIT, Sasseur REIT, Landmark REIT, Frasers Centrepoint Trust, United Hampshire US REIT and Starhill Global REIT — differ considerably in terms of yield, valuation, occupancy, WALE, gearing and interest coverage.
These differences are important because a high distribution yield does not necessarily come with lower risk, while a lower yield may be accompanied by stronger occupancy, scale or financing metrics. The comparison therefore highlights the different trade-offs across the retail REIT sector.

Data reflects the latest available period shown for each REIT and may have different reporting dates.
1. BHG Retail REIT (SGX: BMGU) — Deep Discount, but Low Income and Higher Leverage
• BHG Retail REIT offers a 0.6% distribution yield while trading at 0.66x P/NAV. Its portfolio is 100% retail, comprising six properties with an occupancy rate of 93.8%.
• The REIT stands out for its discounted valuation, but the very low distribution yield, relatively high gearing and weaker interest coverage are important considerations. Its 3.4% YTD performance also indicates that its unit price has remained positive over the period shown, despite a weaker monthly performance.
Tailwinds:
• Discount to NAV: Its 0.66x P/NAV means BHG Retail REIT is trading below the reported net asset value of its portfolio. This provides exposure to its retail properties at a discount to NAV.
• 100% Retail Exposure: The portfolio is 100% retail, giving investors direct exposure to retail properties without diversification into other property types.
• Positive YTD Performance: BHG Retail REIT recorded a 3.4% YTD performance, indicating positive unit price performance over the period shown despite the recent monthly decline.
• Established Property Portfolio: The REIT owns six properties, providing exposure to a portfolio of retail assets rather than a single property.
• Occupancy Above 90%: Its 93.8% occupancy rate indicates that the majority of its retail space is occupied, providing a base of occupied space for rental income generation.
Headwinds:
• Very Low Distribution Yield: At just 0.6%, BHG Retail REIT provides limited current distribution income. This is an important consideration for investors focused on recurring income.
• High Gearing: Its 40.8% gearing indicates a relatively leveraged balance sheet. Higher leverage can reduce financial flexibility, particularly when borrowing costs or refinancing requirements become more challenging.
• Low Interest Cover: BHG Retail REIT’s 1.7x interest cover indicates a relatively limited buffer between operating earnings and interest expenses.
• Relatively High Interest Cost: Its reported 4.3% interest cost represents a significant financing expense that can place pressure on distributable income.
• Relatively Short WALE: Its 2.1-year WALE means a portion of its leases will require renewal or renegotiation over the coming years, making leasing conditions an important consideration.
• Recent Monthly Decline: BHG Retail REIT recorded a -3.2% monthly performance, indicating recent weakness in its unit price, although its YTD performance remained positive at 3.4%.
2. Sasseur REIT (SGX: CRPU) — Strong Yield and Leasing Metrics, but Short WALE
• Sasseur REIT stands out for combining a 9.2% distribution yield with 98.5% occupancy and a 5.0x interest cover. Its portfolio consists of four retail properties, with an AUM of approximately S$1.54 billion.
• At 0.82x P/NAV, it trades below NAV. However, its 0.8-year WALE means lease expiries will require relatively active management, while its four-property portfolio represents a relatively concentrated asset base.
Tailwinds:
• Attractive Distribution Yield: Sasseur REIT offers a 9.2% distribution yield, providing a relatively strong level of current distribution income based on the data provided.
• High Occupancy: The portfolio has an occupancy rate of 98.5%, indicating that the majority of its retail space is occupied and supporting rental income generation.
• Strong Interest Cover: Its 5.0x interest cover indicates a substantial buffer between operating earnings and interest expenses.
• Lower Gearing: Gearing stands at 25.4%, indicating a comparatively lower level of leverage and providing greater balance-sheet capacity.
• Discount to NAV: At 0.82x P/NAV, the REIT trades below its reported NAV, providing exposure to its retail property portfolio at a discount to NAV.
Headwinds:
• Short WALE: Its 0.8-year WALE means a significant portion of leases may require renewal or renegotiation in the near term. This makes tenant retention and rental renewal conditions important considerations.
• Limited Number of Properties: Sasseur REIT has four properties, meaning its portfolio is concentrated across a relatively small number of assets.
• Negative YTD Performance: Its YTD performance is -5.1%, indicating that its unit price has declined over the period shown despite the reported distribution yield.
• Interest Cost: Its 3.9% interest cost represents a significant financing expense that needs to be considered alongside its distribution yield and interest-cover position.
3. Landmark REIT (SGX: D5IU) — Deep Discount but Weak Income Profile
• Landmark REIT presents a 0.26x P/NAV valuation, alongside 29 properties and an 86.5% occupancy rate.
• However, its reported 0.0% yield and S$0.0000 TTM DPU significantly change its income profile. The substantial discount to NAV therefore needs to be considered alongside the absence of current distribution income and its financing metrics.
Tailwinds:
• Deep Discount to NAV: Landmark REIT trades at 0.26x P/NAV, meaning its market valuation is substantially below its reported NAV.
• Large Property Portfolio: With 29 properties, Landmark REIT has a broad portfolio of retail assets, providing exposure across multiple properties rather than relying on a single asset.
• Longer WALE: Its 2.7-year WALE provides a period of lease visibility before those leases come up for renewal or renegotiation.
• Property Yield: The reported property yield is 8.48%, providing an indication of the yield generated at the property level based on the data provided.
Headwinds:
• No Current Distribution: Landmark REIT has a reported 0.0% yield and S$0.0000 TTM DPU, meaning the REIT is currently not providing distribution income based on the figures shown.
• Low Occupancy: Its 86.5% occupancy rate indicates that a portion of its portfolio remains unoccupied. Vacant space can place pressure on rental income and may require leasing efforts to improve occupancy.
• High Interest Cost: Its 6.6% interest cost represents a significant financing expense that can place pressure on earnings and distributable income.
• Negative Performance: Landmark REIT recorded a -22.2% YTD performance, indicating a decline in its unit price over the period shown.
• Interest Cover: Its 2.0x interest cover indicates a relatively limited buffer between operating earnings and interest expenses.
4. Frasers Centrepoint Trust (SGX: J69U) — Scale, Occupancy and Portfolio Quality
• Frasers Centrepoint Trust has an AUM of approximately S$7.51 billion, 10 properties, 99.49% occupancy and a 5.4% yield.
• Its 0.93x P/NAV valuation is relatively close to NAV, while gearing stands at 40.4%. The combination of a large asset base, very high occupancy and relatively low interest cost gives FCT a profile supported by strong portfolio utilisation and financing metrics, although its gearing and relatively short WALE remain important considerations.
Tailwinds:
• Very High Occupancy: Its 99.49% occupancy rate indicates that almost all of its portfolio space is occupied, supporting the generation of rental income.
• Large Asset Base: FCT has an AUM of approximately S$7.51 billion across 10 properties, providing exposure to a substantial portfolio of retail assets.
• Low Interest Cost: Its reported 3.0% interest cost indicates a relatively low financing cost, which can help limit pressure from interest expenses.
• Strong Interest Cover: FCT’s 3.6x interest cover indicates a healthy buffer between operating earnings and interest expenses.
• Positive Distribution Yield: Its 5.4% yield provides an ongoing distribution income component based on the reported figures.
Headwinds:
• Higher Gearing: Gearing is 40.4%, indicating a relatively leveraged balance sheet. Higher leverage can reduce financial flexibility when borrowing costs rise or refinancing requirements become more challenging.
• Moderate Distribution Yield: Its 5.4% yield provides current distribution income, but the level of yield needs to be considered alongside its valuation and other financial metrics.
• Near-NAV Valuation: At 0.93x P/NAV, FCT trades relatively close to its reported NAV. This means the valuation does not reflect as large a discount as a deeply discounted REIT might.
• Relatively Short WALE: FCT’s 1.7-year WALE means a portion of leases will require renewal or renegotiation over the coming years. This makes leasing conditions and tenant retention important considerations.
• Negative YTD Performance: FCT recorded a -9.9% YTD performance, indicating that its unit price has declined over the period shown despite its high occupancy and large asset base.
5. United Hampshire US REIT (SGX: ODBU) — High Yield with Leverage and Financing Considerations
• United Hampshire US REIT provides exposure to US retail properties and has 23 properties, an occupancy rate of 97.7% and an 8.5% yield.
• The REIT trades at 0.66x P/NAV, while gearing stands at 41.1%. Its 8.0-year WALEprovides longer lease-duration visibility, while its financing profile includes a 4.9% interest cost and 2.4x interest cover.
Tailwinds:
• High Distribution Yield: The reported 8.5% yield provides a significant current distribution income component based on the figures provided.
• High Occupancy: Occupancy stands at 97.7%, indicating that the majority of its portfolio is occupied and supporting rental income generation.
• Long WALE: Its 8.0-year WALE provides a relatively long period of lease visibility before leases require renewal or renegotiation.
• Discount to NAV: At 0.66x P/NAV, the REIT trades below its reported NAV, providing exposure to its property portfolio at a discount to NAV.
• Large Property Base: The REIT owns 23 properties, providing exposure across a broad portfolio of US retail assets.
Headwinds:
• High Gearing: At 41.1%, gearing indicates a relatively leveraged balance sheet. Higher leverage can reduce financial flexibility, particularly during periods of higher borrowing costs or refinancing requirements.
• Higher Interest Cost: Its 4.9% interest cost represents a significant financing expense that can place pressure on distributable income.
• Moderate Interest Cover: Its 2.4x interest cover provides a buffer between operating earnings and interest expenses, although financing costs remain an important consideration.
• Negative YTD Performance: The REIT recorded -4.9% YTD performance, indicating that its unit price has declined over the period shown.
• US Market Exposure: The REIT’s properties are located in the United States, giving investors exposure to the US retail property market as well as currency considerations when assessing the investment.
6. Starhill Global REIT (SGX: P40U) — Diversified Retail and Office Exposure
• Starhill Global REIT has 86.3% retail and 13.7% office exposure, giving it a combination of retail and office properties.
• It has nine properties, 97.2% occupancy, a 6.6% yield and 0.73x P/NAV. Its 7.3-year WALE provides relatively long lease-duration visibility, while gearing stands at 35.8%.
Tailwinds:
• Attractive Distribution Yield: Starhill Global REIT’s 6.6% yield provides a meaningful current distribution income component based on the reported figures.
• Discount to NAV: Its 0.73x P/NAV indicates that the REIT is trading below its reported NAV, providing exposure to its property portfolio at a discount to NAV.
• High Occupancy: Occupancy is 97.2%, indicating that the majority of its portfolio is occupied and supporting rental income generation.
• Long WALE: Its 7.3-year WALE provides a relatively long period of lease visibility before leases require renewal or renegotiation.
• Moderate Gearing: At 35.8%, its gearing indicates a moderate level of leverage within the portfolio’s capital structure.
• Diversified Property Exposure: Approximately 86.3% of the portfolio is retail and 13.7% is office, providing exposure to both retail and office properties rather than a portfolio consisting entirely of one property type.
Headwinds:
• Negative YTD Performance: Starhill Global REIT recorded -11.0% YTD performance, indicating a decline in its unit price over the period shown.
• Portfolio Size: The REIT has nine properties and an AUM of approximately S$2.73 billion, representing the scale of its current property portfolio.
• Office Exposure: The 13.7% office allocation means Starhill Global REIT is not purely exposed to retail properties. Office assets have different leasing characteristics and operating considerations from retail properties.
• Financing Costs: Its reported 3.7% interest cost represents an ongoing financing expense that needs to be considered when assessing its distribution income.
• Interest Cover: Its 3.0x interest cover indicates a buffer between operating earnings and interest expenses, although financing costs remain an important consideration.
Note: Financial and operational data shown reflects the latest available figures provided for each REIT and may relate to different reporting periods. Figures should therefore be considered as a snapshot of each REIT’s reported position rather than a like-for-like measurement taken on the same date.
Singapore Retail REIT Sector: Key Tailwinds and Headwinds
Singapore’s retail REIT sector presents a wide range of characteristics, with significant differences in distribution yield, valuation, occupancy, leverage and lease duration. The figures provided show that there is no single profile across the sector, with individual REITs offering different combinations of income, valuation and portfolio characteristics.
Key Tailwinds
• High Occupancy Across Several Portfolios: Several of the REITs report occupancy rates above 97%, indicating strong utilisation of their properties and providing an important base for rental income.
• Discounted Valuations: BHG Retail REIT, Sasseur REIT, Landmark REIT, United Hampshire US REIT and Starhill Global REIT all trade below NAV based on the reported P/NAV figures. This creates a range of valuation discounts across the sector.
• Strong Income Potential: Sasseur REIT, United Hampshire US REIT and Starhill Global REIT report yields of 9.2%, 8.5% and 6.6%, respectively, providing relatively high levels of current distribution income.
• Large and Diversified Portfolios: REITs such as Frasers Centrepoint Trust and United Hampshire US REIT have larger property portfolios, while Landmark REIT has 29 properties, providing exposure across multiple assets.
• Longer Lease Duration for Some REITs: United Hampshire US REIT and Starhill Global REIT report WALEs of 8.0 years and 7.3 years, respectively, providing relatively long lease-duration visibility.
Key Headwinds
• Interest-Rate and Financing Costs: Interest costs range from 3.0% to 6.6% across the REITs shown. Higher financing costs can place pressure on distributable income and refinancing.
• Elevated Gearing: Several REITs have gearing around or above 40%, increasing the importance of balance-sheet management and refinancing conditions.
• Short WALE for Some REITs: Sasseur REIT’s 0.8-year WALE, FCT’s 1.7-year WALE and BHG Retail REIT’s 2.1-year WALE indicate that lease renewals will be an important consideration over the coming years.
• Uneven Occupancy: While several REITs report occupancy above 97%, Landmark REIT’s 86.5% and BHG Retail REIT’s 93.8% show that occupancy conditions vary considerably across the sector.
• Weak Recent Performance for Several Counters: BHG Retail REIT, Sasseur REIT, Landmark REIT, FCT, United Hampshire US REIT and Starhill Global REIT show differing YTD and monthly performance figures, with several recording negative YTD performance.
• Low or Zero Distribution Income for Some REITs: BHG Retail REIT reports a 0.6% yield, while Landmark REIT reports 0.0% yield and S$0.0000 TTM DPU. This creates a significant difference in income profiles across the sector.
Sector Takeaway
The Singapore retail REIT sector therefore offers different combinations of income, valuation, occupancy, lease duration and balance-sheet characteristics. Some counters trade at substantial discounts to NAV, while others have larger asset bases, high occupancy or longer WALEs. At the same time, gearing, interest costs, lease expiries and distribution levels remain important factors when assessing the individual REITs.
For investors, the key consideration is not simply the headline yield or discount to NAV, but how these figures interact with occupancy, leasing requirements, financing costs and the overall quality and scale of the underlying property portfolio.
POWER UP YOUR REIT ANALYSIS
• Comprehensive Screening: Data on over 30+ Singapore REITs
• Real-Time Fundamental Metrics: Yield, Gearing, P/NAV, WALE
• Risk & Debt Analysis: (e.g., Weighted Average Debt Maturity, Interest Cover)
• Performance Tracking: TTM DPU and Price History
SIGN UP NOW and Explore the full screener at: reitsavvy.com/reits-screener
Kenny Loh is a distinguished Wealth Advisory Director (RNF# LKK300389588 Representing Financial Alliance) with a specialization in holistic investment planning and estate management. He excels in assisting clients to grow their investment capital and establish passive income streams for retirement. Kenny also facilitates tax-efficient portfolio transfers to beneficiaries, ensuring tax-efficient capital appreciation through risk mitigation approaches and optimized wealth transfer through strategic asset structuring.
With over a decade of experience in holistic estate planning, Kenny employs a unique “3-in-1 Will, LPA, and Standby Trust” solution to address clients’ social considerations, legal obligations, emotional needs, and family harmony. He holds double master’s degrees in Business Administration and Electrical Engineering, and is an Associate Estate Planning Practitioner (AEPP), a designation jointly awarded by The Society of Will Writers & Estate Planning Practitioners (SWWEPP) of the United Kingdom and Estate Planning Practitioner Limited (EPPL), the accreditation body for Asia.
You can join his Telegram channel #REITirement – SREIT Singapore REIT Market Update and Retirement related news. https://t.me/REITirement