REITs that may be most impacted by Interest Rate Hikes
The US Fed raised interest rates by 75 basis points on June 15, 2022, which is the biggest hike in 28 years. Coupled with post-pandemic recovery, this raises the question: How will REITs be impacted by the Interest Rate Hike? This will depend on the REIT, and many factors, not limiting but including:
- REIT Sector (Retail, Office, Industrial etc.)
- Sponsor of REIT (Stronger sponsors tend to attain better refinancing deals)
- Market Capitalization (The bigger the REIT, generally the more resilient its portfolio)
- Historical performance
- Debt Maturity Length (Weighted Average)
- Cost of Debt (Weighted Average)
- Gearing Ratio
- % of Fixed Rate Debt
Fundamentals: Sector, Sponsor and Market Capitalisation
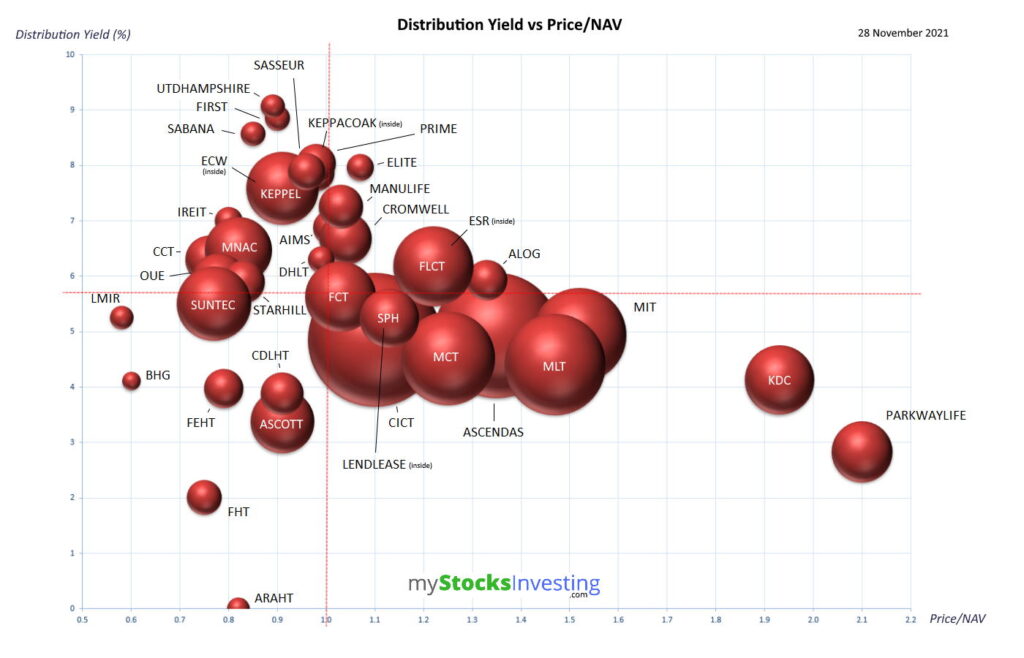
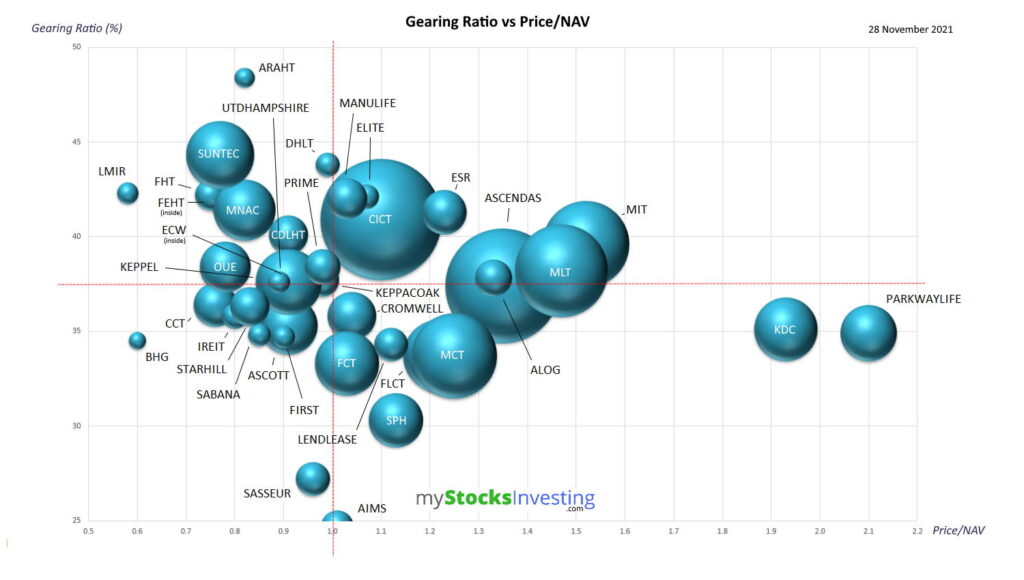
Generally, by combining the market capitalisation, gearing ratio, debt maturity profile and all-in interest cost, these can give investors insights on how big the interest rate hike impacts the future DPU of REITs.
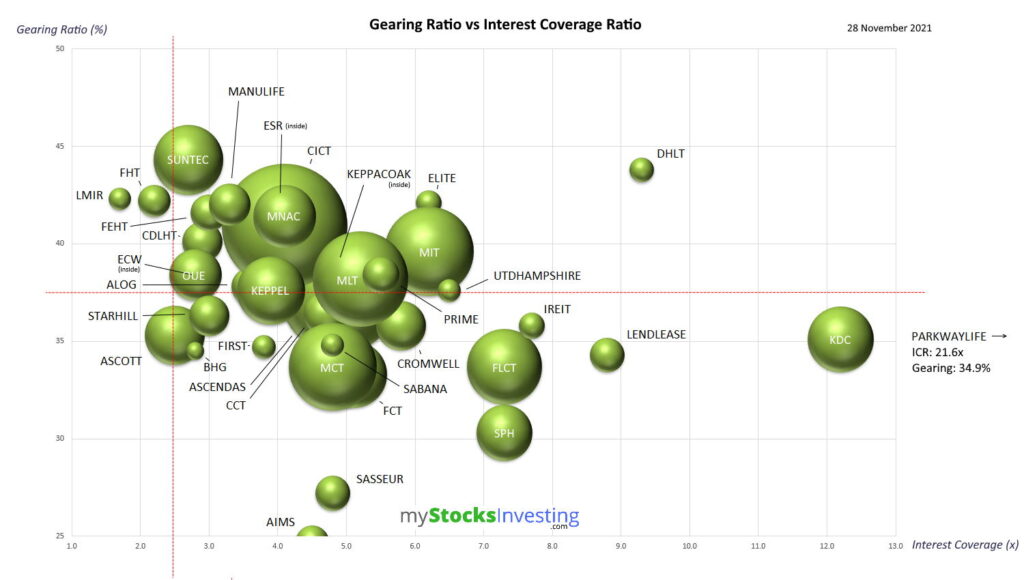
In the bubble chart below, REITs with short WADM would have to refinance the debt at the highest interest rate and that will further compress the spread of DPU yield and cost of debt.
The most risky combination would be high gearing and short WADM as the REITs would probably face challenges to keep the cost of debt manageable during the refinancing exercise, as the credit rating may be downgraded due to a weaker balance sheet. The reputation of the sponsor and its market capitalisation would be very crucial at this juncture.
Legend
x-axis: Weighted Average Debt Maturity (Years)
y-axis: Weighted Average Cost of Debt (Years)
Bubble Size: Gearing Ratio (The bigger the bubble the higher the gearing ratio, in green) and Market Cap (in yellow)
For comparison, Digital Core REIT (26.0%) and ARAHT (44.9%).


If you want to learn about REITs more in depth, I am conducting an upcoming REIT course, where I will explain on how these ratios (Cost of Debt, WADM and Gearing) can affect its performance during Interest Rate Hikes, as well as many other factors (macro and micro) and financial ratios that can affect a REIT’s performance. You’ll receive student notes (over 300 slides long) and knowledge on all you need to know about investing in REITs (and how to get started).
Upcoming REIT Course
I will be conducting my next REIT course on the 16th and 23rd July 2022. It is a 2-day course where you will learn everything you need to learn about REITs for investing. I only conduct this course every quarter, so do take a look below. For a limited time only, the course fee is subsidized to cost $200 (above 40y/o) or $600 (below 40y/o)*. Take advantage of the IBF subsidy while it is still available.
You can register by clicking the link here: Building a Diversified REIT Portfolio – SGX Academy
Registration will close on 11th July, 2022.

Kenny Loh is an Associate Wealth Advisory Director and REITs Specialist of Singapore’s top Independent Financial Advisor. He helps clients construct diversified portfolios consisting of different asset classes from REITs, Equities, Bonds, ETFs, Unit Trusts, Private Equity, Alternative Investments, Digital Assets and Fixed Maturity Funds to achieve an optimal risk adjusted return. Kenny is also a CERTIFIED FINANCIAL PLANNER, SGX Academy REIT Trainer, Certified IBF Trainer of Associate REIT Investment Advisor (ARIA) and also invited speaker of REITs Symposium and Invest Fair. You can join my Telegram channel #REITirement – SREIT Singapore REIT Market Update and Retirement related news. https://t.me/REITirement