Mapletree Industrial Trust (MIT): Under Watchlist & Entry Planning

  • Post author:

MIT Logo

Base on the Mapletree Industrial Trust (MIT) Investor Presentation on Mar 11, 2016.

  • Last Done Price = $1.60
  • Market Cap = $2.88 B
  • NAV = $1.33
  • Price /  NAV = 1.2030 (20% Premium)
  • Price / NAV (High) = 1.46
  • Price / NAV (Low) = 1.13
  • Gearing Ratio = 29.3%
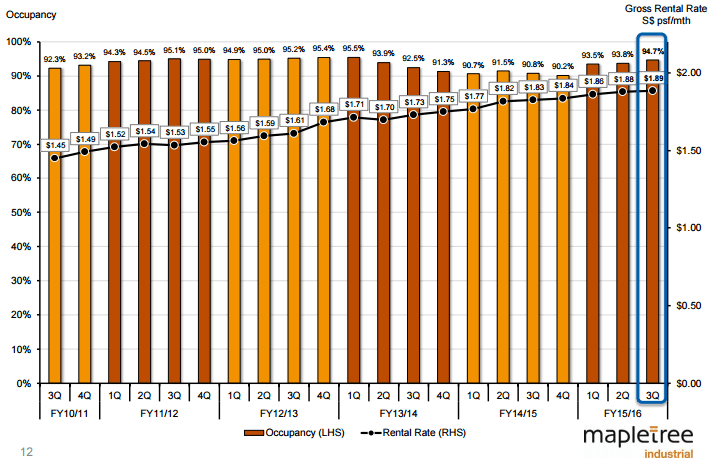
  • Occupancy Rate = 94.7%
  • WALE = 2.9 Years
  • WADM = 4.2 Years

See previous analysis of Mapletree Industrial Trust (MIT) here.

.

Mapletree Industrial Trust Structure June28-2015MIT Portfolio Location Mar25-2016

MIT DPU Growth Mar25-2016MIT Occupancy Mar25-2016MIT Occupancy by segment Mar25-2016MIT Diversification by sector Mar25-2016 MIT Diversification Mar25-2016MIT WALE Mar25-2016MIT WADM Mar25-2016


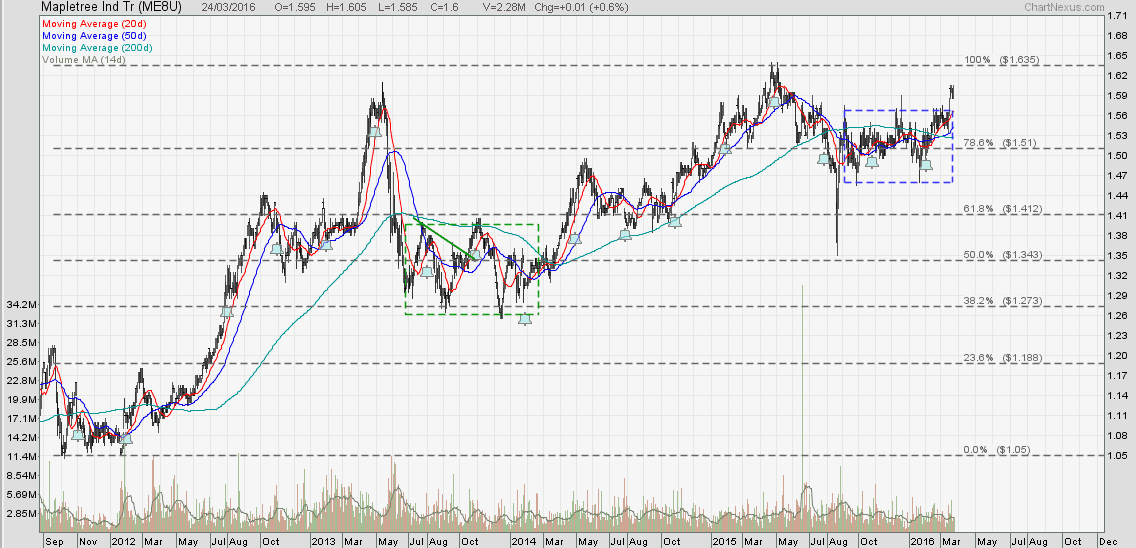
Mapletree Industrial Trust (MIT) Stock Chart and Technical Analysis

Mapletree Ind REIT Mar25-2016


Yield and Price/NAV Simulation for Entry Planning

MIT Yield and Price NAV simulation Mar 25-2016


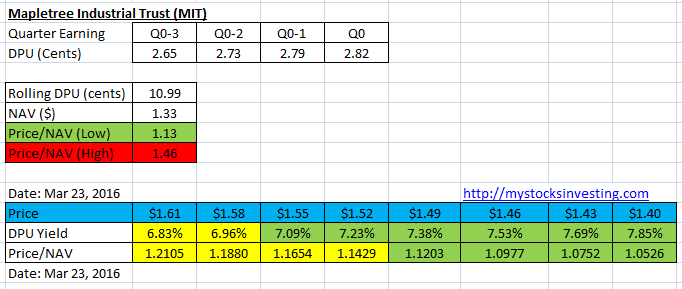
I am combining Fundamental Analysis, Technical Analysis, Yield & Price/NAV simulation to determine a safe entry on my REIT investing to Maximize the Return, Protect Initial Capital and Minimize Losses if the market turns bearish. I will be sharing my REIT investing analysis techniques in my course. Check out the Investing in Singapore REIT course here.

Continue ReadingMapletree Industrial Trust (MIT): Under Watchlist & Entry Planning

Mapletree Industrial Trust Fundamental and Technical Analysis

  • Post author:

Mapletree Industrial Trust Fundamental Analysis on May, 2015.

  • Last Done Price = $1.56
  • Market Cap = $2.75 B
  • NAV = $1.32
  • Price /  NAV = 1.18 (18% Premium)
  • Price /  NAV (High) = 1.46
  • Price /  NAV (Low) = 1.16
  • Distribution Yield = 6.795%
  • Gearing Ratio = 30.6%
  • WADB = 4.2 Years
  • WALE = 3.1 Years
  • Occupancy Rate = 90.2%

Mapletree Industrial Trust DPU History June28-2015Mapletree Industrial Trust Structure June28-2015Mapletree Industrial Trust Diversification June28-2015 Mapletree Industrial Trust Occupancy June28-2015 Mapletree Industrial Trust Top 10 Tenants June28-2015 Mapletree Industrial Trust WADM June28-2015 Mapletree Industrial Trust WALE June28-2015

Mapletree Industrial Trust Technical Analysis

Mapletree Ind REIT June30-2015

Mapletree Industrial Trust has rebounded from the 200D SMA support and still maintain a long term up trend. However, investors have to be cautious because a Head and Shoulder (trend reversal) chart pattern is in formation. It is important to watch closely whether Mapletree Industrial Trust can stay above the $1.50-$1.52 support zone.

Check out Singapore REIT Course Detail here to learn how to conduct Trend Analysis & Fundamental Analysis for Singapore REIT.  https://mystocksinvesting.com/course/singapore-reits-investing/

Continue ReadingMapletree Industrial Trust Fundamental and Technical Analysis

Mapletree Industrial Trust: Getting Near to Historical High

  • Post author:

Technically Mapletree Industrial Trust is getting near to Historical High amid the fear of interest rate hike. Who said the interest hike will make the REIT under-perform as what all the analysts said?

Mapletree Ind REIT April10-2015

  • Last Done Price = $1.60
  • NAV = $1.21
  • Price /  NAV = 1.32 (32% Premium)
  • Price /  NAV (High) = 1.458
  • Price /  NAV (Low) = 1.155
  • Distribution Yield = 6.675%
  • Gearing Ratio = 32.8%

See other Singapore REIT comparison table here.

Continue ReadingMapletree Industrial Trust: Getting Near to Historical High