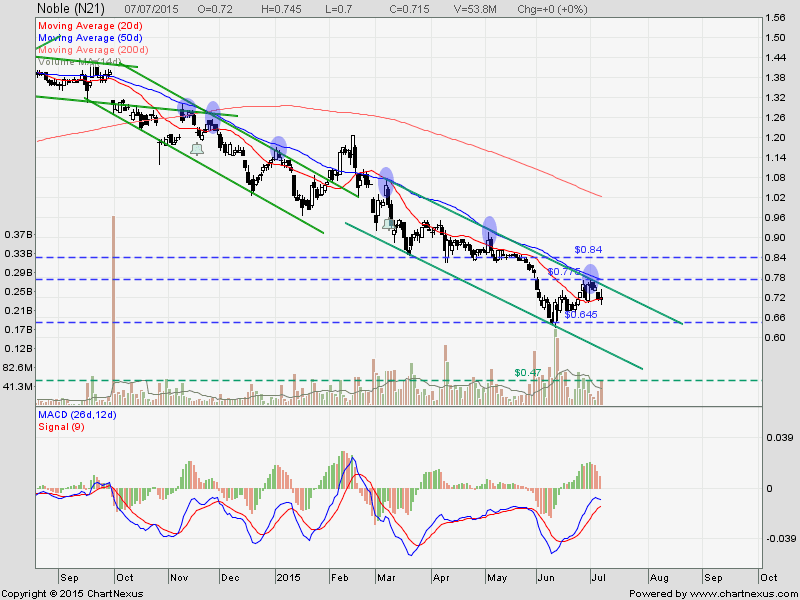
Noble Group: Continue Down Trend
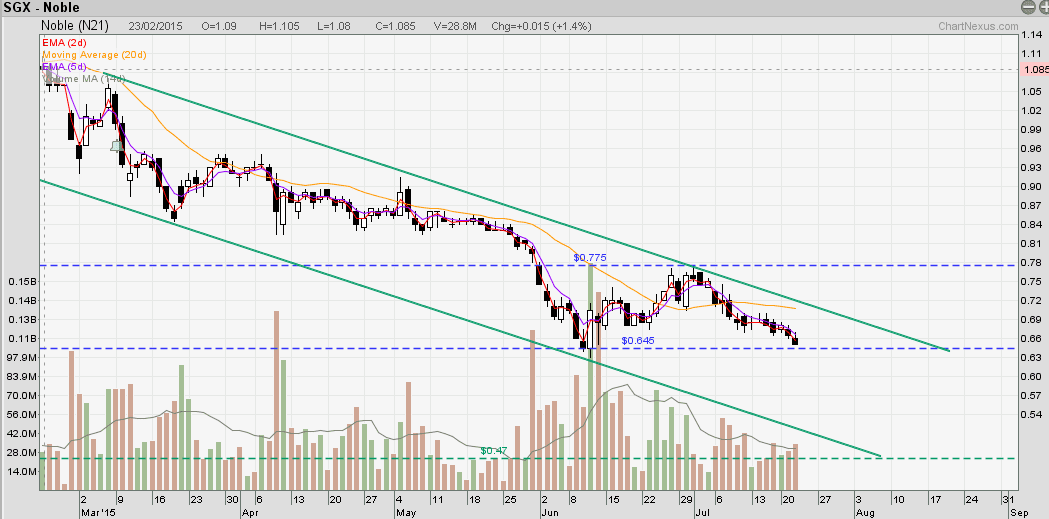
Noble Group looks like going to break the recent low support of $0.645. If this support is broken, next support is at $0.47. Continue to short Noble until there is a reversal pattern. So, trade with the trend. The Trend is your friend!
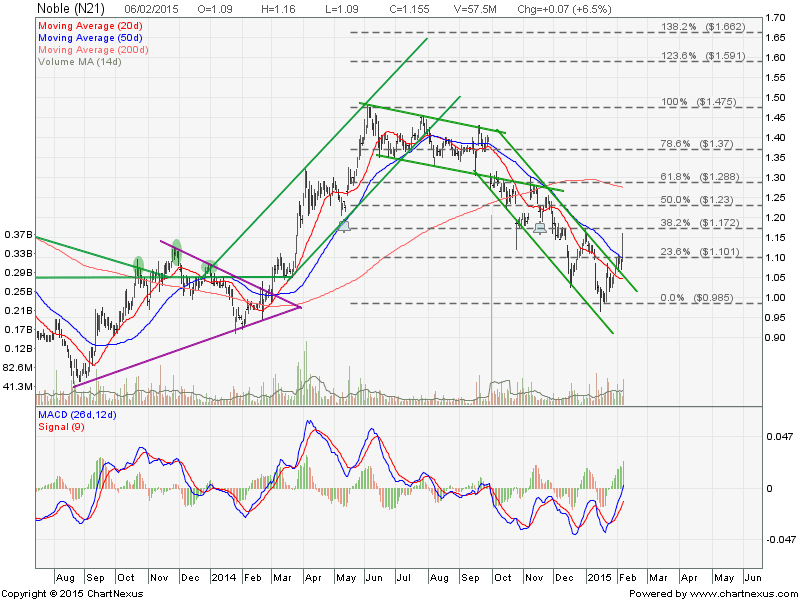
Previous Noble Group Technical Analysis.
- Current PE = 29.99.
- Current PB = 0.6284
Note: 2nd Quarter Earning Release on Aug 12, 2015.