Author: Michael Williams
The VIX is a highly touted index on CNBC and in financial circles, but what is it and what does it represent? You may hear it called the “Fear Index”, but that too is a misnomer and not an accurate representation of what it is. Certainly there are times based on the price of this index that it construes fear, but other times it may reflect complacency.
What is it?
The VIX is a number derived from the prices of options premium in the S&P 500 index (which is an index comprising 500 large cap stocks).
It is a good indicator of the expectation of market volatility, note I said “expectation”, it is not representative of the actual volatility or what will happen. This is a very important point; it is just a general assumption based on the premiums investors are willing to pay for the right to buy or sell stock.
This premium in options can be loosely defined as risk. Just like other forms of insurance, the greater the risk the higher the premiums, and the lower the risk the lower the premiums. When the options premium fall the VIX falls and when premiums rise the VIX rises. The VIX is not set by any one person, but rather the results of millions of transactions by millions of traders from around the world. The buyers and sellers move the option prices, more buyers and the premiums go up, more sellers and the premiums go down. The VIX takes a weighted average of all these options prices in the S&P 500 index and derives a single number that is called the VIX.
This one VIX number gives us a general idea if investors are paying more or less for the right to buy or sell the S&P 500 index.

What does the number mean?
For those interested in what the number mathematically represents, here it is in the most simple of terms. The VIX represents the S&P 500 index +/- percentage move, annualized for one standard deviation. Example, if the VIX is currently at 15. That means, based on the option premiums in the S&P 500 index, the S&P is expected to stay with in a +/- 15% range over 1 year, 68% of the time (which represents one standard deviation).
Is it high or low?
Historically speaking, the VIX below 20 means that the market is forecasting a rather healthy and low risk environment. However, if the VIX falls too low it reflects complacency and that is dangerous, implying everyone is bullish. Remember the story of the “Shoe Shine Boy”, if everyone is bullish there are no buyers left and the market comes tumbling down.
If the VIX heads higher than 20, then fear is starting to enter into the market and it is forecasting a higher risk environment. If it goes too high, then everyone is singing the “chicken little” song.
Remember the VIX is not set by any one person or even groups of people; it is solely determined by order flow of all buyers and sellers of options. One could extrapolate an equilibrium level, where the market (risk premium) is fairly priced based on the economic landscape.
If we look at historical points of the VIX we see that during the height of the great housing crisis in 2008 and 2009 the VIX rocketed to levels far above 50. Think about that for a second and what that means. For our understanding of the model, the options are pricing that the S&P 500 index (the largest 500 companies) will be in a range of +/- 50% over the year, 68% of the time. At one point the VIX spiked to 85. Those are insane levels that can never be maintained for very long. The VIX quickly came falling back down and then went too far the other way and fell below 15. Again, during the crisis the VIX would have us believe that all is well and that the S&P 500 index has a very low probability of making any radical moves, again the VIX was wrong and it moved back up.
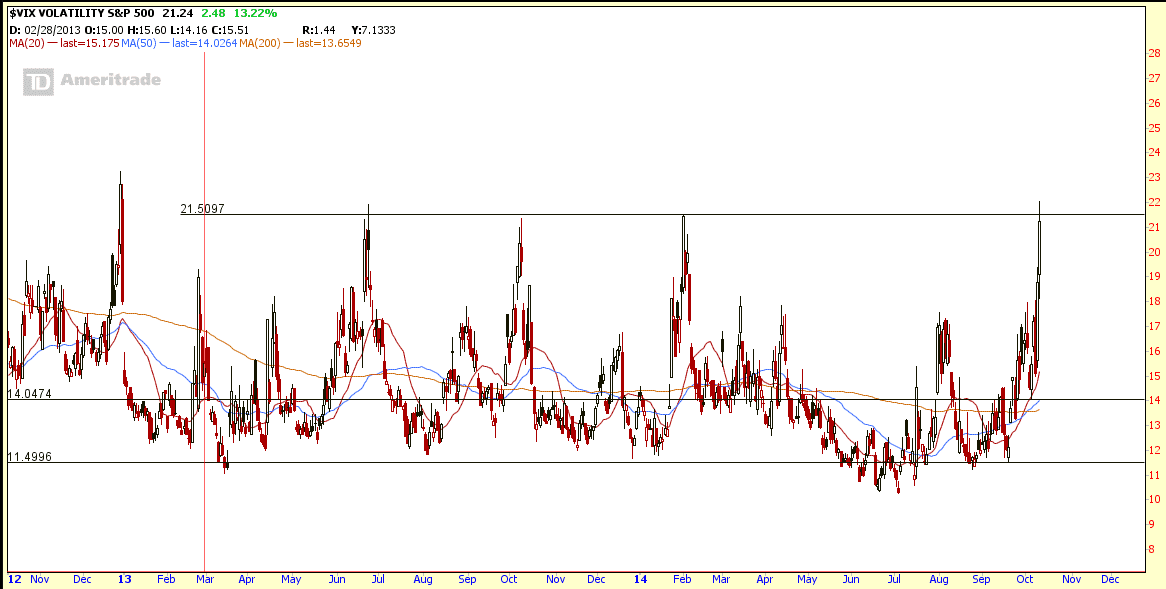
So where is the mean? That is a very good question. I think it depends on two distinct but different factors. First it is the perception of the political and economic climate and second it is the actual fundamental soundness or the math that brings us back to reality. There is perception and mathematical reality and the VIX lies somewhere in between. In my personal opinion and from experience, based on the current geo-political environment I would say the VIX is fairly priced in the 20 point range (+/- 2). However, that mean will change as economic, market, and political conditions change.
Is the VIX correct?
I believe the volatility of the VIX is a direct representation of man’s inability to effectively understand risk and price the unknown. The VIX had remained in the low 20s in 2008 when we all knew that problems were quickly spinning out of control, the VIX spiked, correcting its previous assumption. However, it spiked far beyond reality as panic drove option premiums (insurance prices) into the stratosphere. It quickly again over compensated as it fell. The VIX suffered huge whipsaws in 2009, 2010, and 2011 trying to over compensate and find some realm of equilibrium between perception and math.
The VIX has the same human flaw of perception that is found in the equity markets that frequently drive stock prices too high or too low. Human perception can quickly lead to greed or fear, rather than focusing on the math and fundamentals. It is easy to get sucked into the abyss of frenzied social idiocy. Logic, reason, and wisdom are cast aside as we are driven by irrational greed or fear.
“Hidden Volatility”
I have a saying known as “Hidden Volatility”; this is when the market premium [options premium] contracts as the equity markets start to consolidate. We know that the market will not consolidate [form a wedge] indefinitely and when it does break out (up or down), it could be a violent move. I equate the term “hidden volatility” to a compressed spring. We cannot see the energy in that spring, but we know it is there and when the energy is finally released it moves fast and violently. How much power is needed and how long that power can last to keep that spring contracted is something that physics can answer; however, in the market that equation is driven by supply and demand. In many cases it is a catalyst event that unleashes the power as one side steps away and forces the other side into full capitulation.
Hidden Volatility happens when volatility in both the equities and options premium contracts. Sometimes in the media they will refer to this as “Greed” or “Complacency”, however what is really happening is that the options premium is below and continuing to decline further than where the mean “should be”. This is subjective, but can certainly be seen and experienced at its extremes.
This is usually a huge warning sign for me that the market will see a rather large and violent correction, usually to the down side.
Conclusion
The VIX is a helpful tool and indicator. It gives a current and accurate measure of where options premium in the S&P 500 index is trading. However, it is very important that we understand that the VIX is not right or wrong in its current or forecast measurement of S&P 500 volatility. It is just where the market is willing to trade the premium or current measurement of risk. At the extremes we see that it is wrong and quickly tries to compensate, as buyers quickly become sellers or sellers quickly turn into buyers. It is driven more by the perception and human condition of fear and greed, than by any other force.
Our job as investors, traders, and risk managers is to understand what it is and what it isn’t – to find and estimate a range of accuracy and then determine if human fear or greed is driving it to one extreme or another.
At these tails of extreme there are huge opportunities, for one must see others’ fear or greed as an opportunity and not be sucked in like the rest of the lemmings.
Trading the VIX
VIX is both a tradeable cash based options and futures index.
Some VIX options and futures products are: UVXY, VXX, VIIX.
The VIX options and futures can be used to both hedge a long portfolio or even used to take a position in the VIX.
It is important when trading VIX products that one understands its inverse relationship to the equity markets. The VIX will usually rise in value (price) as the stock market (primarily the S&P index) declines.
To hedge a long portfolio one could purchase call options or take a long VIX future position. The general idea is if the long portfolio declines sharply in price the VIX will rise in price and the call options would increase in value. This is a typical hedging method use for large long basket positions.
It is sometimes easier to think of trading VIX options opposite of how you would trade the options in the S&P. If you think the S&P is heading sharply lower then purchasing VIX call options would benefit. If you think the S&P is heading sharply higher then purchasing VIX put options would benefit.
The most frequent problem that new traders have in the VIX markets is understanding its inverse relationship.