FTSE ST Real Estate Investment Trusts (FTSE ST REIT Index) increases from to 826.94 to 834.92 (+0.97%) compare to last post on Singapore REIT Fundamental Comparison Table on Nov 5, 2017. The index continues within uptrend channel after retested the 820 resistance turned support. All 3 moving averages (20D, 50D, 200D) are showing strong upward momentum.

Fundamental Analysis

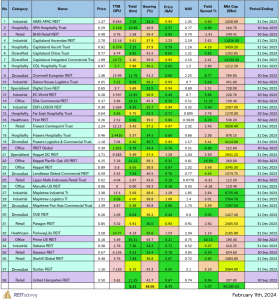
- Price/NAV stays at 1.06 (Singapore Overall REIT sector is over value now).
- Distribution Yield increases from 6.36% to 6.42% (take note that this is lagging number). About one third number of Singapore REITs (11 out of 37) have Distribution Yield > 7%.
- Gearing Ratio reduces from 34.3% to 34.1%. 17 out of 37 have Gearing Ratio more than 35%. In general, Singapore REITs sector gearing ratio is healthy.
- Most overvalue REIT is Parkway Life (Price/NAV = 1.73), followed by Keppel DC REIT (Price/NAV = 1.53), First REIT (Price/NAV = 1.37) and Mapletree Industrial Trust (Price/NAV = 1.40).
- Most undervalue (base on NAV) is Fortune REIT (Price/NAV = 0.70) and Sabana REIT (Price/NAV = 0.73).
- Highest Distribution Yield (TTM) is SoilBuild BizREIT (8.94%), followed by Cache Logistic Trust (8.22%), Lippo Mall Indonesia Retail Trust (8.48%) and Sabana REIT (8.10%).
- Highest Gearing Ratio is iREIT Global (41.7%).
Disclaimer: The above table is best used for “screening and shortlisting only”. It is NOT for investing (Buy / Sell) decision. To learn how to use the table and make investing decision, Sign up next REIT Investing Seminar here to learn how to choose a fundamentally strong REIT for long term investing for passive income generation.
Economy Analysis – Singapore

- 1 month increases from 1.00413% to 1.00513%
- 3 month increases from 1.12583% to 1.12658%
- 6 month maintains at 1.25000%
- 12 month maintains at 1.37758%

The Singapore Manufacturing PMI increased to 52.6 in October 2017 up from 52 in the previous month. The reading pointed to the fastest pace of expansion in the manufacturing sector since December 2009, boosted by a strong performance of new orders and new exports orders, growing employment and a positive overall outlook for manufacturing. The PMI for the electronics sector came in at 53.3, slightly down from 53.6 in September, but still expansionary. Manufacturing PMI in Singapore averaged 50.23 from 2012 until 2017, reaching an all time high of 52.60 in October of 2017 and a record low of 48.30 in October of 2012.
Manufacturing PMI in Singapore is expected to be 53.00 by the end of this quarter, according to Trading Economics global macro models and analysts expectations. Looking forward, we estimate Manufacturing PMI in Singapore to stand at 51.40 in 12 months time. In the long-term, the Singapore Manufacturing PMI is projected to trend around 50.20 in 2020, according to our econometric models.

The Singaporean economy grew 5.2 percent year-on-year in the third quarter of 2017, following an initial estimate of 4.6 percent and up from 2.9 percent in the prior quarter. It is the biggest expansion since the last quarter of 2013, led by a sharp acceleration in manufacturing. On a quarterly basis, the final estimate showed that the GDP grew an annualized 8.8 percent in Q3 (vs a preliminary 6.3 percent), sharply surpassing the downwardly revised 2.2 percent growth of the previous quarter. The Ministry of Trade and Industry announced that the Singapore economy is expected to grow by 3.0-3.5 percent in 2017 and by 1.5-3.5 percent in 2018. GDP Annual Growth Rate in Singapore averaged 6.66 percent from 1976 until 2017, reaching an all time high of 19 percent in the second quarter of 2010 and a record low of -8.80 percent in the first quarter of 2009.
GDP Annual Growth Rate in Singapore is expected to be 2.80 percent by the end of this quarter, according to Trading Economics global macro models and analysts expectations. Looking forward, we estimate GDP Annual Growth Rate in Singapore to stand at 2.20 in 12 months time. In the long-term, the Singapore GDP Annual Growth Rate is projected to trend around 1.80 percent in 2020, according to our econometric models.
Summary
Fundamentally the whole Singapore REITs is over value now. Office rental and price index seems like reversing the trend. Do watch out for the turnaround of this office sector in 2018. Technically Singapore REITs continues the bullish uptrend after the Singapore REITs Index broke the 820 resistance. It is expected the bullish sentiment to continue as Singapore economy fundamental is strengthening based on improved PMI and stronger GDP numbers. December 2017 rate hike to 1.5% has already been priced in and unlikely there will be any knee jerk reaction to the Singapore REIT.
I attached the summary slides of (1) Review of 2017 Singapore REIT performance and (2) Singapore REIT 2018 Market Outlook which I have presented to various groups retail investors (organised by Adam Khoo Learning Technologies Group and Shareinvestor) in the past few weeks.


Safe hunting!
See all other relevant Singapore REITs blog posts here.
Check out coming seminars at https://mystocksinvesting.com/events
- REITs Portfolio Advisory. https://mystocksinvesting.com/course/private-portfolio-review/
- Singapore REITs Investing Course https://mystocksinvesting.com/course/singapore-reits-investing/