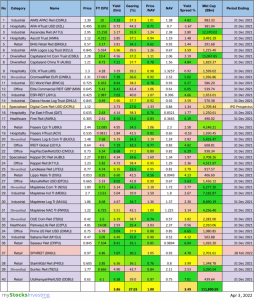
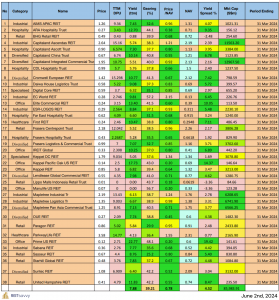
Bubble chart derived from August 8, 2016 Singapore REITs Fundamental Comparison Table. Compare to previous Singapore REIT Bubble Chart; distribution yield for big and mid cap Singapore REIT have decreased due to increase of the share price. Those small cap Singapore REITs with > 8% distribution yield are SoilbuildBizReit (SV3U), Lippo Malls Trust (D5IU), Cambridge Ind Trust (J91U), Sabana Reit (M1GU), Croesus RTrust (S6NU), Cache Log Trust (K2LU), IREIT Global (UD1U) and Viva Ind Trust (T8B)
These Bubble Charts are used to show the “relative” position compare to other Singapore REITs.
Two visual bubble charts to pick and avoid:
- Undervalue Singapore REITs with High Distribution Yield** (Value Pick)
- Overvalue Singapore REITs with High Gearing Ratio (Risk Avoidance)
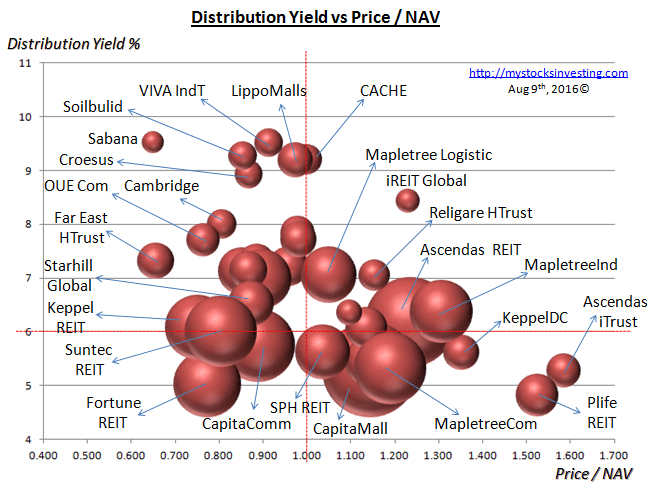

** Distribution Yield are lagging.
How to use this Singapore REIT Bubble Charts?
Original Post from https://mystocksinvesting.com
Disclaimer: The analysis is for Author own use and NOT to be used as Buy / Sell recommendation.