
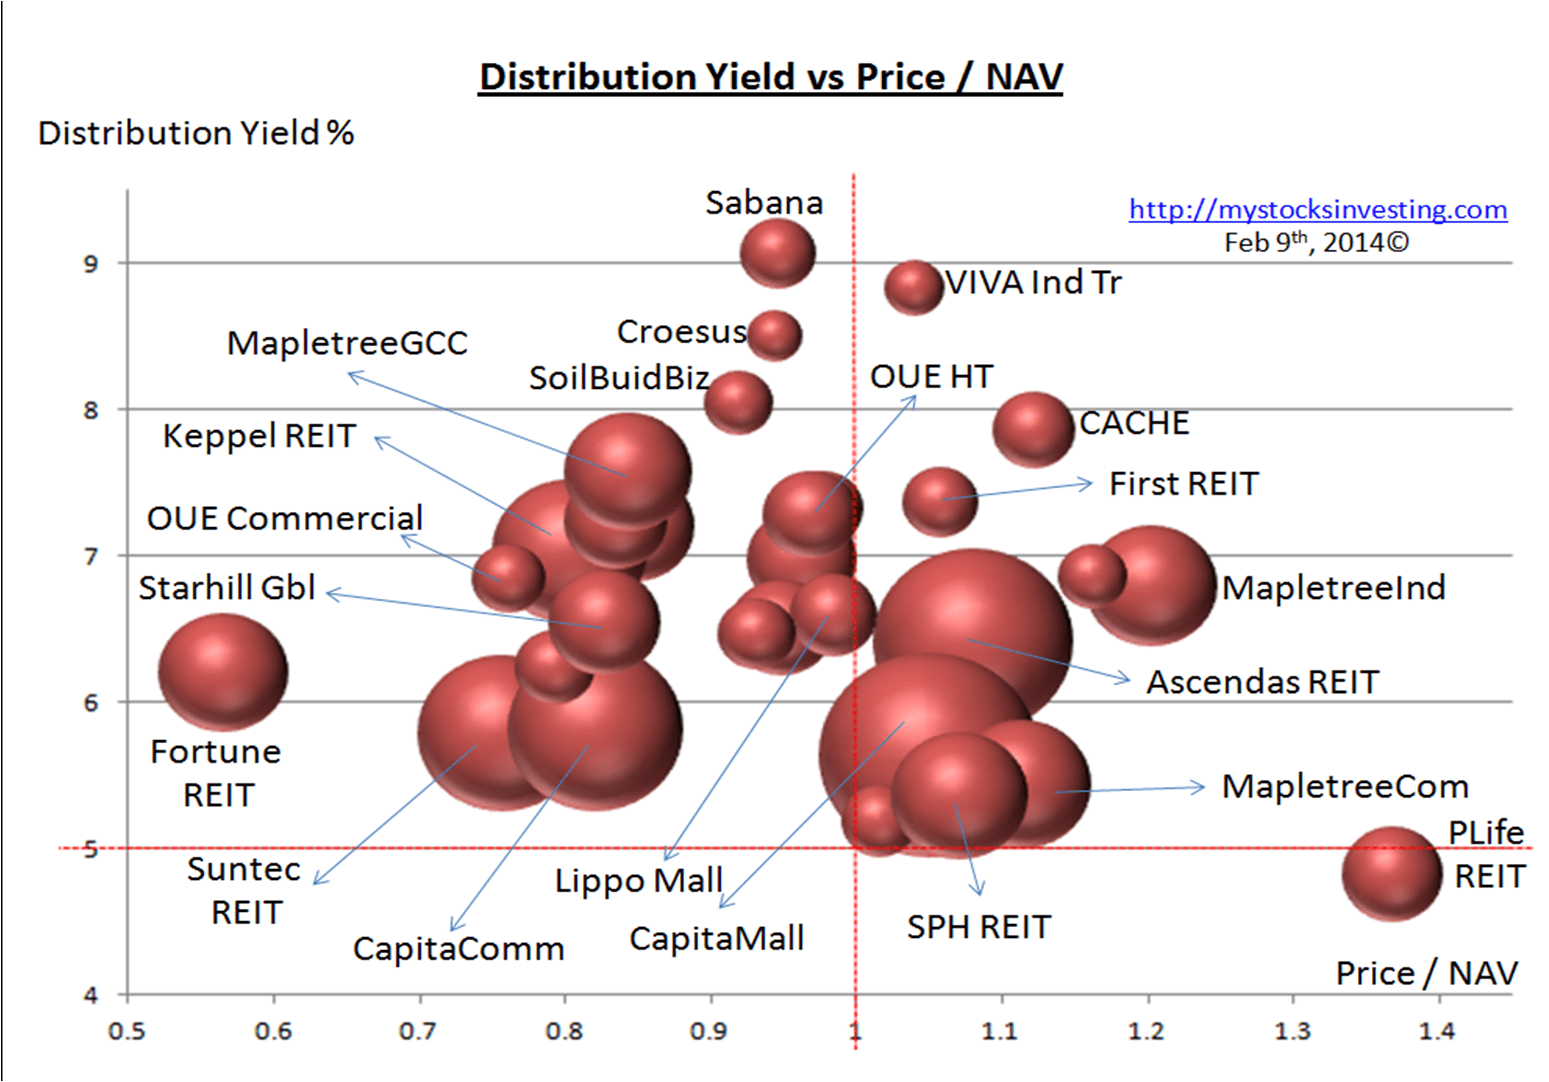
Added SoilBuildBiz REIT, VIVA Industrial Trust and OUE Commercial REIT which were just IPOed recently. These Bubble Charts are used to show the “relative” position compare to other Singapore REITs.
Two visual bubble charts to pick and avoid:
- Undervalue Singapore REITs with High Distribution Yield (Value Pick)
- Overvalue Singapore REITs with High Gearing Ratio (Risk Avoidance)

See Last Singapore REIT Bubble Charts here.
See detail Singapore REITs Fundamental Comparison Table here.
Although some of the REITs are attractive for long term investing to generate passive income but do remember to look at the chart first because cheap REIT can become cheaper when the stock price is on the down trend.
Disclaimer: This is NOT a recommendation to buy or sell. The authors do not guarantee the accuracy of the data and NOT responsible to any wrong interpretation by the readers.
Pingback: [Official] REITs CD tracking thread - Page 124 - www.hardwarezone.com.sg