
VIVA Industrial Trust Fundamental Analysis on July 24, 2015.
- Last Done Price = $0.735
- Market Cap = $515 M
- NAV = $0.83
- Price / NAV = 0.8855 (11% Discount)
- Price / NAV (High) = 1.08
- Price / NAV (Low) = 0.89
- Distribution Yield = 10.09%
- Gearing Ratio = 38.9%
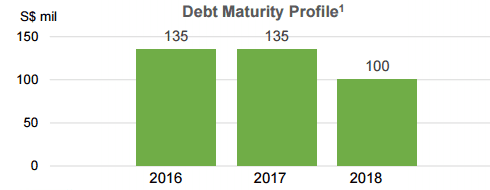
- WADM = 2.2 Years
- WALE = 3.3 Years
- Occupancy Rate = 80%
VIVA Industrial Trust IPO Prospectus


VIVA Industrial Trust Technical Analysis & Stock Chart

VIVA Industrial Trust has broken the 200D SMA support and currently in on the down trend.
Although the 10% yield looks very attractive and the trust is undervalue, be extremely careful on the current economic outlook and the income support scheme because the dividend may not be sustainable.


Check out Singapore REIT Course here on how to identify the risks and analyse the sustainability of Singapore REIT. https://mystocksinvesting.com/course/singapore-reits-investing/
..