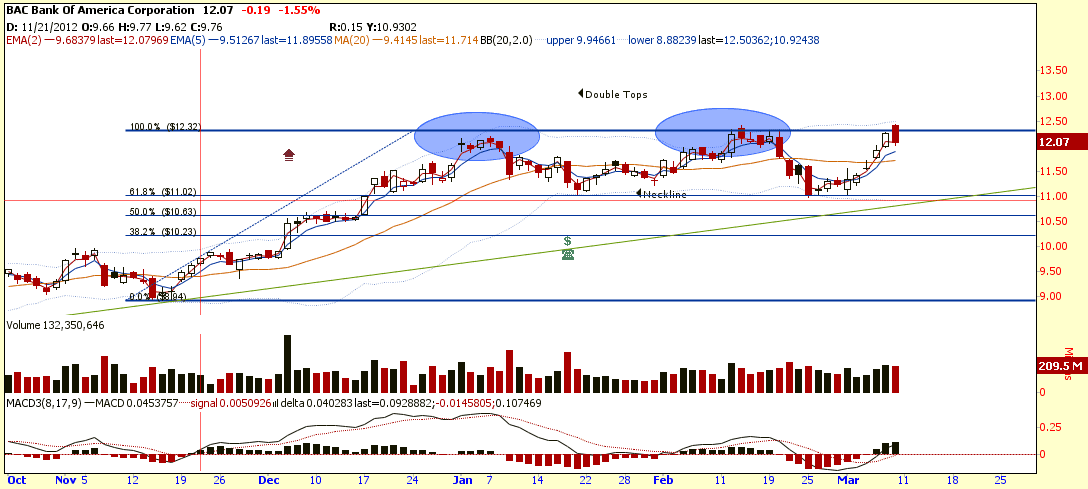
Bank of America (BAC): Beware Triple Tops!
BAC formed a Dark Cloud Cover reversal candlestick pattern at the resistance and have a potential of forming a Triple Tops pattern. I moved my stop loss just below $12.00 psychological support to protect my profit.
Possible Scenarios & Trading Plan:
- If BAC can stay above the $12.00 support, I will stick to my trading plan to let BAC to head towards $14.40 (161.8% FR). I will continue to move my stop loss upward to protect the profit.
- If BAC breaks $12.00 support, I will be stopped out. The next plan is to wait for BAC to retrace back to the neckline of $11.00 (also the uptrend channel support – marked in green) and see whether this support can be hold. If there is reversal pattern at $11.00, I will long BAC again. If the $11.00 support is broken, there will be a breakout of Triple Tops chart pattern with price target below $10.00. I may consider to short BAC using Put option.
See previous BAC analysis and chart pattern with different time scale here.