Keppel REIT: Starts Down Trend!

  • Post author:

Keppel REIT broke down from the Rectangle (a consolidation pattern for close to 8 months) and starts down trend. This is not unexpected due to the high gearing ratio which is very sensitive to interest rate hike.

Keppel REIT June10-2015

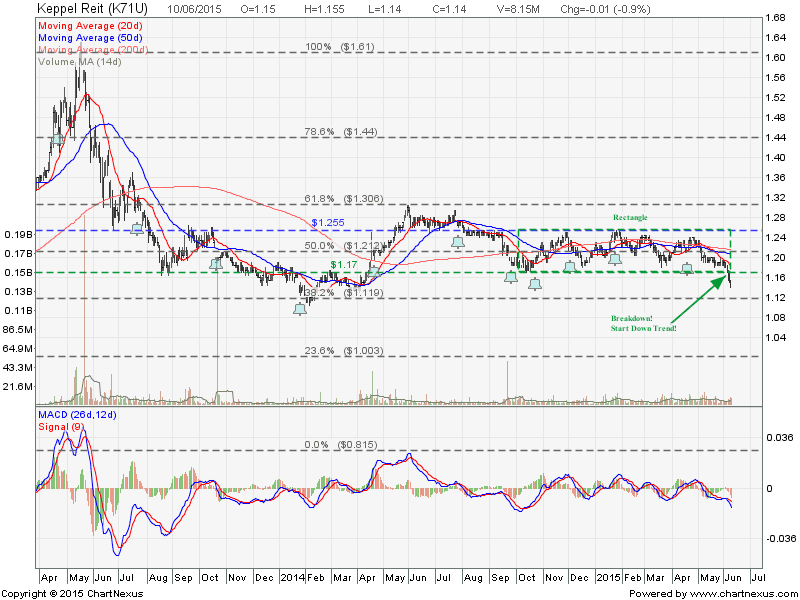
Base on previous chart pattern, 20D SMA is a reliable resistance when Keppel REIT is on down trend. So, it is a good opportunity to short when there is a dead cat bounce back to 20D SMA resistance.

Learn how to Short Sell Singapore Stocks here.

Keppel REIT Fundamental Data

  • Last Done Price = $1.14
  • NAV = $1.39
  • Price / NAV = 0.82
  • Price / NAV (High) = 1.13
  • Price /NAV (Low) = 0.80
  • Gearing Ratio = 42.4%
  • Distribution Yield = 5.965%

See other Singapore REITs Fundamental Analysis Comparison Table here.

Continue ReadingKeppel REIT: Starts Down Trend!

Wilmar: Range Bound in Rectangle

  • Post author:

Wilmar is currently trading within a range in a Rectangle chart pattern. Wilmar is expected to move sideway until breakout to either direction. Nothing to trade until breakout.

2015April25-Wilmar

Original post by Marubozu My Stocks Investing Journey.

Current P/E Ratio (ttm) 13.4378
Estimated P/E(12/2015) 11.9183
Relative P/E vs. FSSTI 0.9515
Earnings Per Share (USD) (ttm) 0.1810
Est. EPS (USD) (12/2015) 0.2040
Est. PEG Ratio 1.3459
Market Cap (M SGD) 20,720.77
Shares Outstanding (M) 6,395.30
30 Day Average Volume 4,349,957
Price/Book (mrq) 1.0039
Price/Sale (ttm) 0.3612
Dividend Indicated Gross Yield 2.31%
Cash Dividend (SGD) 0.0550
Dividend Ex-Date 05/04/2015
5 Year Dividend Growth 4.56%
Next Earnings Announcement 05/07/2015
Continue ReadingWilmar: Range Bound in Rectangle

City Development: Start of a New Up Trend?

  • Post author:

Is City Development starting a new uptrend after rebounded from the 200D SMA support? Base on 20D and 50D SMA direction, it looks like City Development is starting a new bull round. Need to see whether $10.55 resistance turned support level can be hold to confirm the uptrend. This level is also the 61.8% Fibonacci Retracement Level if using $10.00 as 0% FR and $10.90 as 100% FR. Immediate resistance at $10.90 followed by $11.09.

2015April17-CITYDEV-800x600

There are many interesting chart patterns in City Development like Descending Triangle, Inverted Head and Shoulders, Rectangle, Channels, which can increase the winning probability. Want to learn how to increase your winning probability trades by using the reliable chart patterns? Check out  High Winning Probability Trading with Chart Patterns course here.

Current P/E Ratio (ttm) 12.7611
Estimated P/E(12/2015) 15.4506
Relative P/E vs. FSSTI 0.9005
Earnings Per Share (SGD) (ttm) 0.8330
Est. EPS (SGD) (12/2015) 0.6880
Est. PEG Ratio 1.5474
Market Cap (M SGD) 9,666.79
Shares Outstanding (M) 909.39
30 Day Average Volume 1,198,430
Price/Book (mrq) 1.1963
Price/Sale (ttm) 2.5680
Dividend Indicated Gross Yield 0.75%
Cash Dividend (SGD) 0.0400
Dividend Ex-Date 04/30/2015
5 Year Dividend Growth 9.86%
Next Earnings Announcement 05/14/2015
Continue ReadingCity Development: Start of a New Up Trend?