Suntec REIT Fundamental and Technical Analysis

  • Post author:

Suntec REIT Fundamental Analysis

Base on Suntec REIT Q1FY15 Quarterly Earning Presentation

  • Last Price = $1.75
  • NAV = $2.085
  • Price / NAV = 0.8393
  • Price / NAV (High) = 0.97
  • Price / NAV (Low) = 0.73
  • Distribution Yield = 5.168%
  • Gearing Ratio = 34.8%
  • Occupancy Rate (Office) = 99.6%
  • Occupancy Rate (Retail) = 93.5%
  • Overall Occupancy = 93.6%
  • WADM = 3.39 Years

Suntec REIT DPU History June12-2015 Suntec REIT Office Lease June12-2015 Suntec REIT Retail Lease June12-2015 Suntec REIT WADM June10-2015

See last Suntec REIT Fundamental Analysis here.

See Recent Sell off of Suntec REIT.


Suntec REIT Technical Analysis

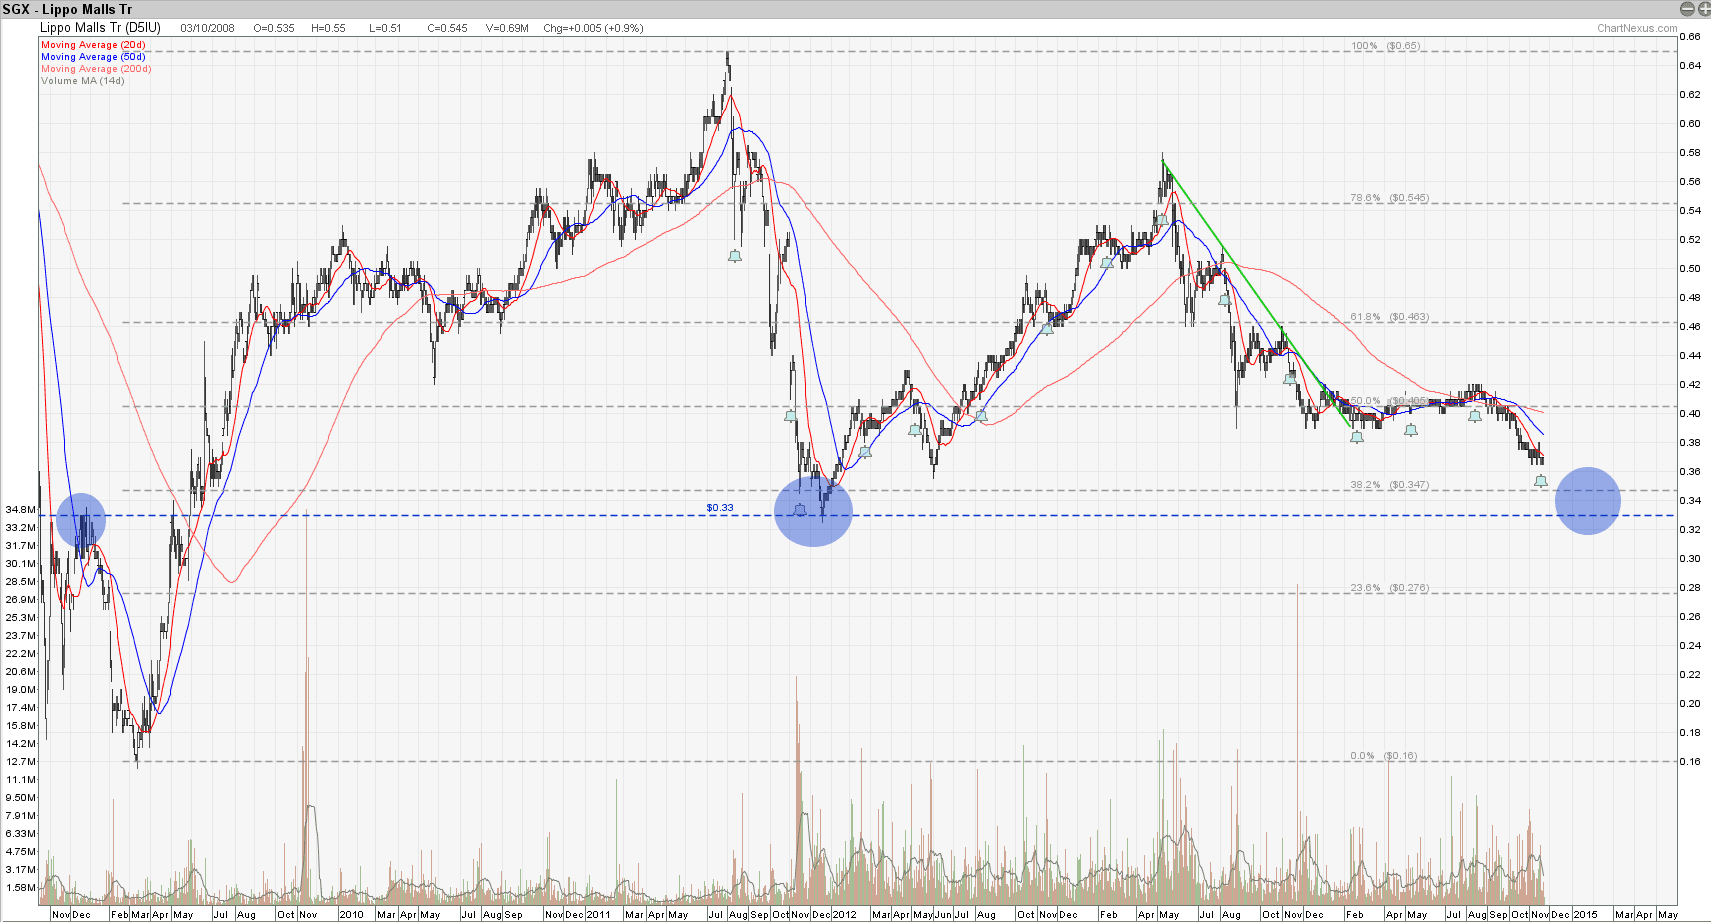
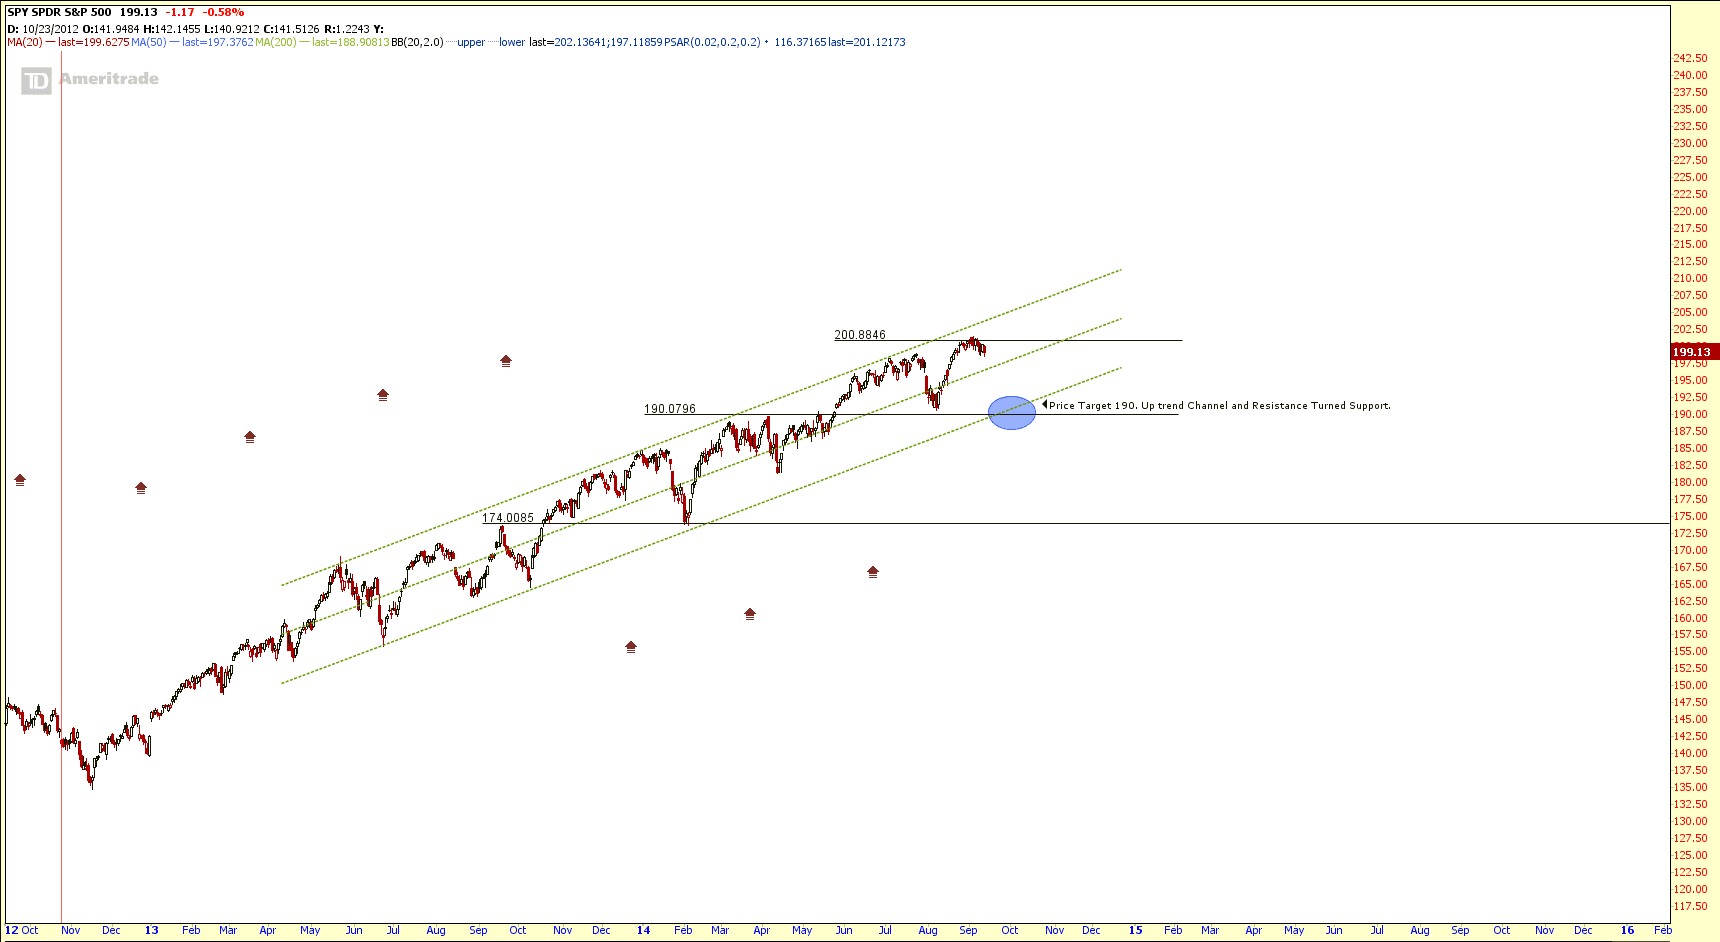
Suntec REIT has dropped about 13% from the peak in Jan 2015 and currently testing a critical resistance turned support level at about $1.74. Can Suntec REIT go lower?

Technically YES!

  • Suntec REIT is trading below 20D, 50D and 200D SMA. 20D and 50D are trending down. These are bearish signal.
  • Suntec REIT is trading within a down trend channel. “Lower Low, Lower High” down trend pattern is formed.
  • If this resistance turned support at $1.74 is broken, there will be more down side.

2015June12 SuntecReit-800x600

In Summary

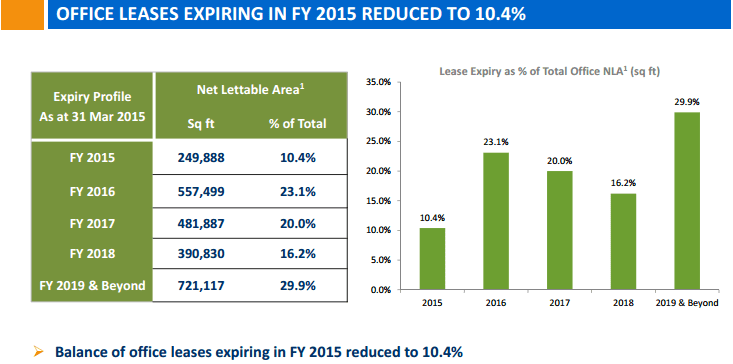
Fundamentally the distribution yield of 5.17% gives me no excitement. There are other Singapore REIT can offer higher distribution yield than Suntec REIT. WALE are not so attractive because there are 25% lease will be expiring in 2016. There is no guarantee that the rental can be renewed at higher rate due to the weakness in global economy. Technically Suntec REIT is on down trend although finding a temporary support at $1.74 (take note that a Double Bottoms is formed, a potential reversal pattern). As an investment rule: NEVER buy when the stock is on down trend.

I will be covering all the Fundamental and Technical Analysis steps in the coming REIT class. Check out the detail HERE. Invest safely and protect your capital! You must know what you are doing and do your own homework instead of listening to the tips.

Continue ReadingSuntec REIT Fundamental and Technical Analysis

Lippo Malls Indonesia Retail Trust (LMIR): Fundamental & Technical Analysis, Risk Assessment

  • Post author:

Fundamental Analysis of Lippo Malls Indonesia Retail Trust (LMIR):

Technical Analysis of Lippo Malls Indonesia Retail Trust (LMIR):

LMIR is currently on the down trend but approaches the previous resistance turned support level at about $0.33. If LMIR is able to hold above $0.33 and consolidate around this support zone, it may be a good entry point in view of the strong fundamental, undervalue NAV and nice DPU yield. Keep an eye on the reversal chart pattern and candlestick patterns when LMIR reaches this support zone.

LMIR Nov 22-14


Risk Assessment:

One of the biggest Risks is currency exchange risk, where LMIR collects rental in IDR but DPU pay out in SGD. Looking at the SGD/IDR chart, SGD/IDR is trading within the range of 9,000 and 9,500. It is good news to LMIR if SGD is weaken against IDR and vice versa.

SGD IDR Exchange Nov22-2014

.


.


.


Continue ReadingLippo Malls Indonesia Retail Trust (LMIR): Fundamental & Technical Analysis, Risk Assessment

SPDR S&P 500 ETF (SPY) : Short Vertical Call Spread

  • Post author:

Technical Analysis & Fundamental Analysis

S&P500 rejected at 2000 historical high and SPY rejected at 200. Technically it looks like SPY is going through a correction with short term price target at 190 (Up Trend Channel Support and also the Resistance turned Support level).

Fundamentally S&P500 is over value base on PE ratio. See PE Ration Comparison table here.

SPY Sept 13-2014


Trade Setup

  • Strategy: Short Term Directional Bearish Trade.
  • Target: $190
  • Short Call Spread SPY 195/200 Oct 2014 (2 contracts)
  • Max gain @ expiration $690
  • Max loss @ expiration $310
  • B/E @ expiration $198.44
  • Reward vs Risk (RoC) = 2.25
  • Probability OTM (short leg) = 29.42%
  • Profit target = $540 (at $190 support)
  • Exit Conditions:
    • When there is a trend reversal at the support ($190)
    • Break $202 resistance convincingly.
    • Reach 80% of Max Profit (ie. $552)

SPY Short Vertical Call Spread Risk Profile Sept 13-2014

Original Post by Marubozu My Stocks Investing Journey

Continue ReadingSPDR S&P 500 ETF (SPY) : Short Vertical Call Spread