See previous week Weekly Inter Market Analysis.
Original post from https://mystocksinvesting.com
SPY (SPDR S&P500 ETF)
SPY rebounded from the resistance turned support zone. SPY is still trading in a Rising Wedge pattern. Keep an eye on on key supports:
- Resistance turned support zone: 211-213
- Rising Wedge immediate support: about 210
- Previous Head and Shoulders neckline support: about 204.
- Rising Wedge next support: about 200

VIX
VIX retraces after last week 40% spike but expect volatility in the coming week as FOMC releases statement on Sept 21.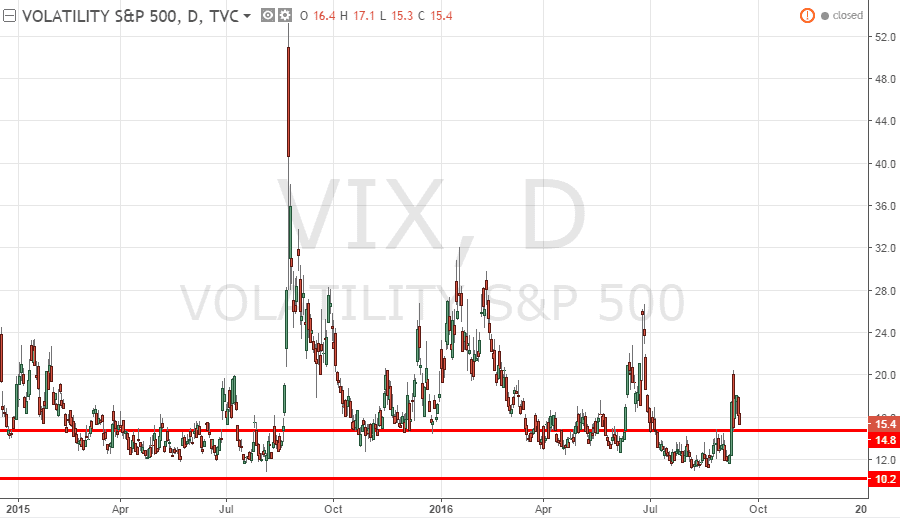
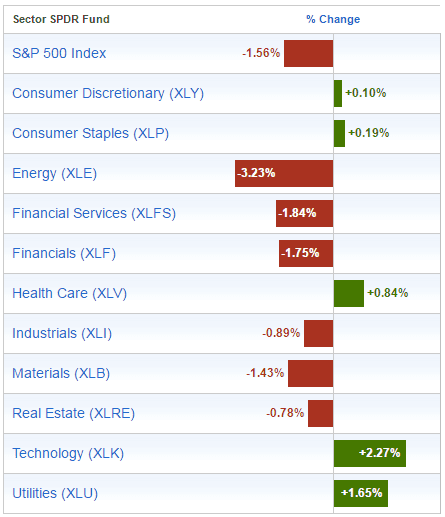
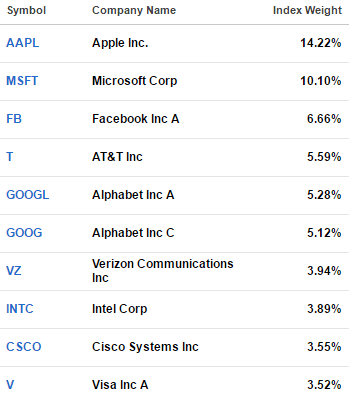
Sector Performance (SPDR Sector ETF)
- Best Sectors: Technology (XLK), Utility (XLU) and Healthcare (XLV)
- Worst Sector: Energy (XLE), Financial Services (XLFS) and Financial (XLF)
- Note: Defensive sectors outperforms aggressive sectors. XLK outperforms due to Apple (AAPL) which has very high weighting of 14.22%.
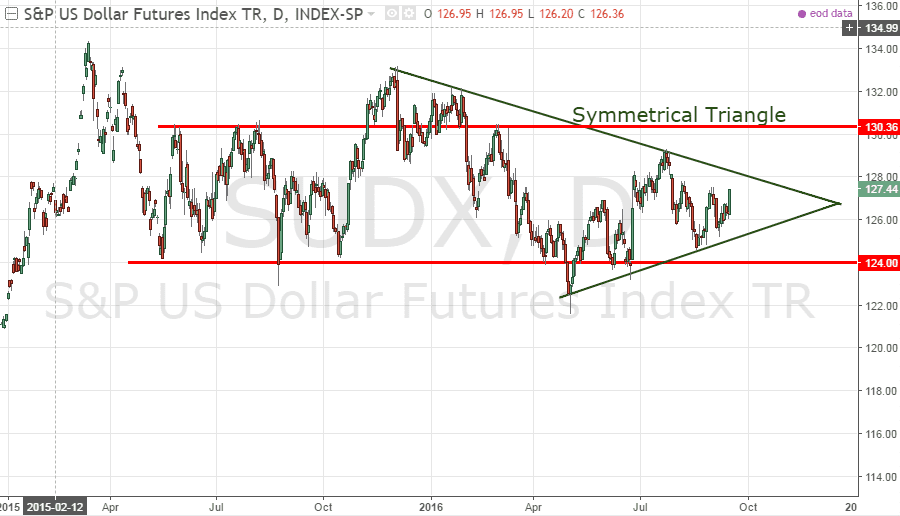
SUDX (S&P US Dollar Futures Index)
SUDX is currently trading within a Symmetrical Triangle and likely to be trading in a tight range until a breakout. Wait for Yellen’s speech on the interest rate hike confirmation.
FXE (Currency Shares Euro ETF)
FXE is curently trading sideway and range bound. Wait for Yellen’s speech on the interest rate hike confirmation before we can see the next big move.

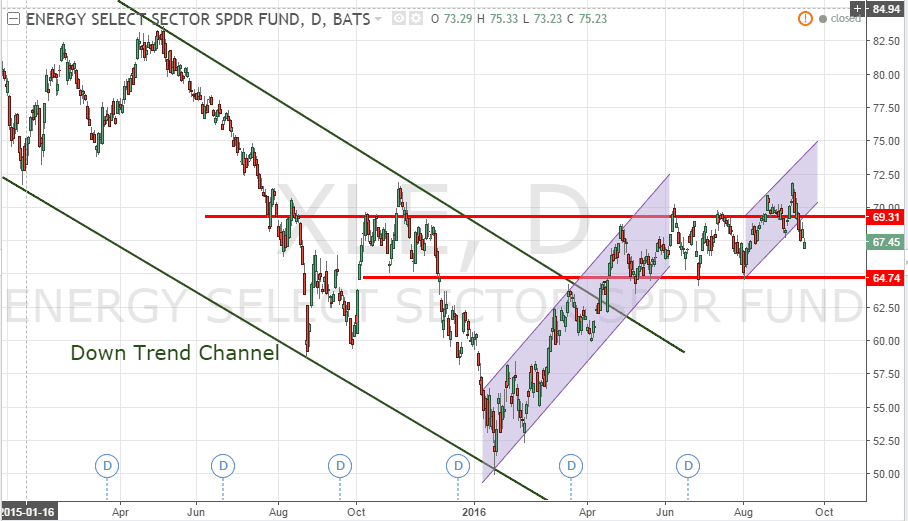
XLE (SPDR Energy Sector ETF)
XLE broke down from the uptrend channel. Next support to watch is 64.74. This support is quite strong as it has been tested for 5 times.
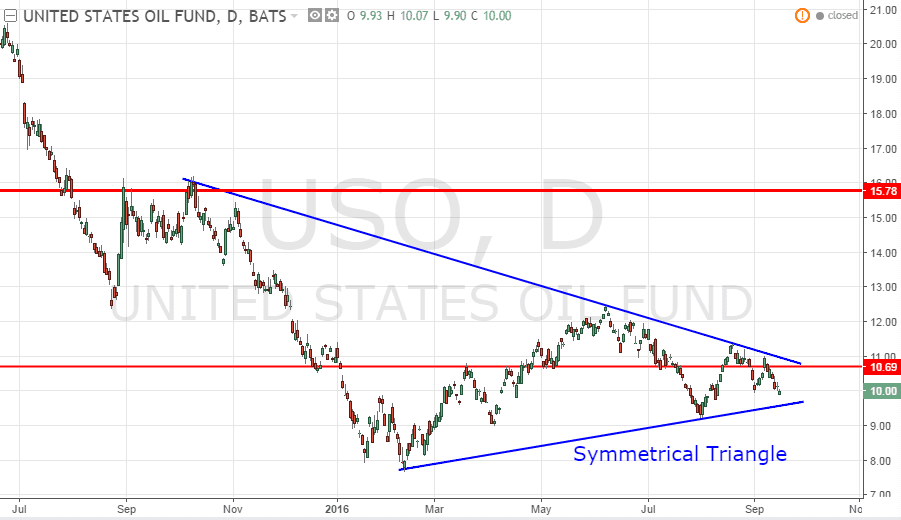
USO (United States Oil Fund)
USO is currently trading in a Symmetrical Triangle. Keep an eye on the next move when USO is trading closer to the apex of the triangle. Watch next Wednesday Sept 21 Crude Oil inventories report.
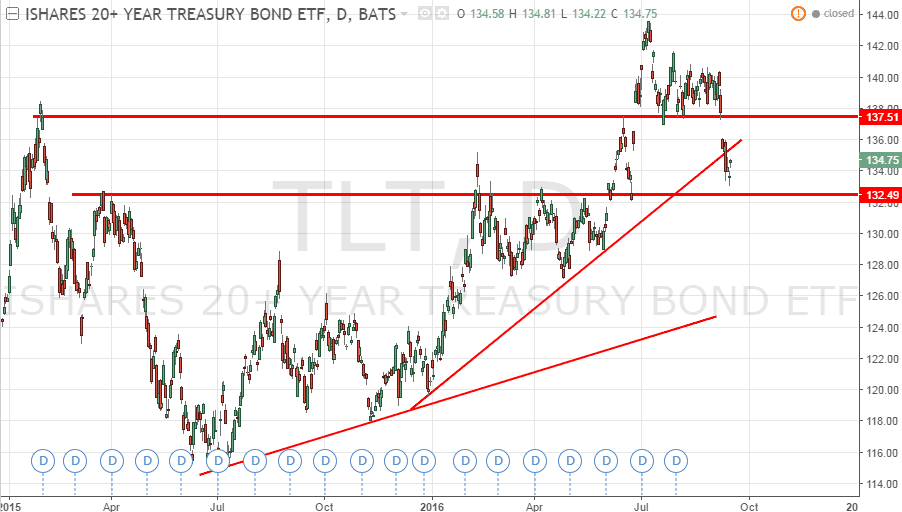
TLT (iShares 20+ Years Treasury Bond ETF)
TLT gapped down and broke the uptrend support. Next important resistance turned support at 132.49.
GLD (SPDR Gold Shares)
Gold is currently trading in a consolidation (Rectangle pattern) and still on uptrend. Currently GLD is just sitting on an important resistance turned support at about 125. This support has been tested 3 times previously. Can this support hold? If this support is broken, there will be a trend reversal as it is a Triple Tops chart pattern breakdown.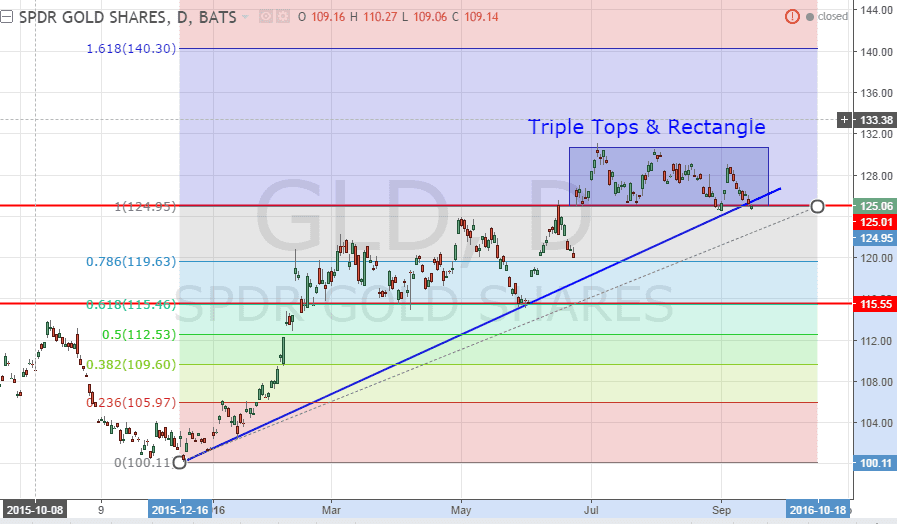
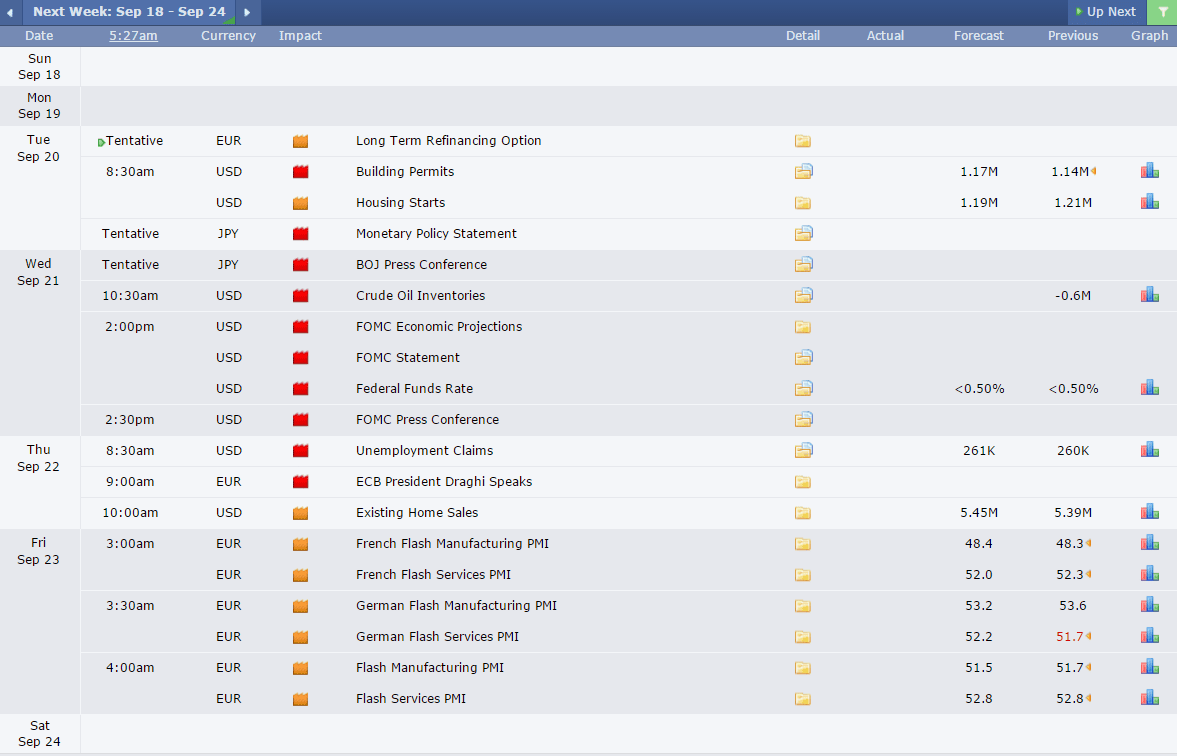
Next Week Economic Calendar
Key event:
- Japan Monetary Policy & BOJ press conference on Sept 20 Tuesday and Sept 21 Wednesday
- FOMC statement on Sept 21 Wednesday
- Crude oil inventories on Sept 21 Wednesday