Starhub: Shooting Stat at 20D SMA Resistance
Starhub was rejected at 20D SMA Resistance with Shooting Star, a potential reversal candlestick pattern. The trend remains bearish. Wait for confirmation to short.


Starhub was rejected at 20D SMA Resistance with Shooting Star, a potential reversal candlestick pattern. The trend remains bearish. Wait for confirmation to short.
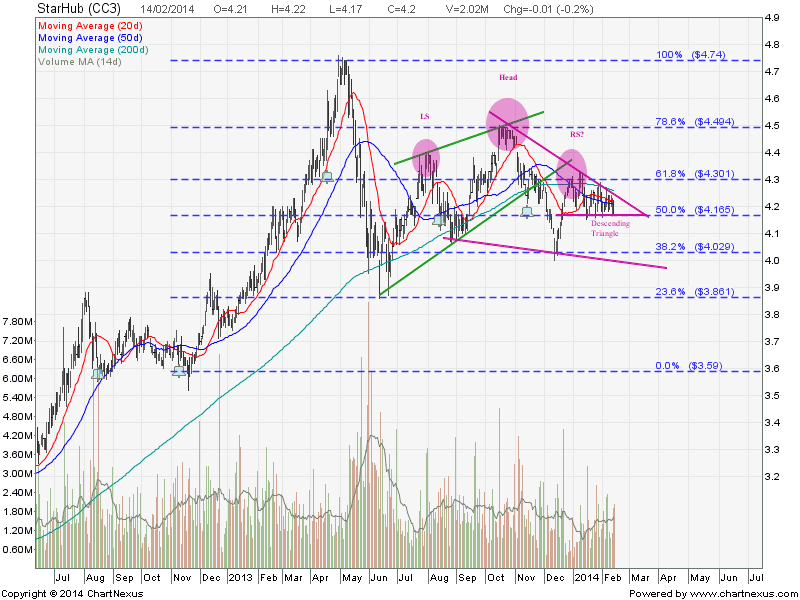
Starhub broke the support zone between $4.00 and $4.03. This level proved to be very strong support and tested 8 times previously. So, this breakdown has to be respected because it does mean something in terms of investor confidence on StarHub. Shorting time on this Singapore Straits Time Index (STI) component stock!

Original post by Marubozu from My Stocks Investing Journey.https://mystocksinvesting.com
Starhub has been in a Descending Triangle consolidation for about 2 months. The trading range is become narrower and the stock price is getting near to the apex of the triangle. Currently Starhub is trading below the 200D SMA resistance which has started to trend down (a bearish signal). Base on the chart pattern, there are tons of resistances (20D, 50D, 200D, Triangle resistance, 61.8% FR) on the current Starhub price. Starhub has high probability of breaking down from the Descending Triangle (neckline at $4.16) with the price target of $4.00. If $4.00 neckline support is broken, the price target the Head & Shoulders chart pattern is $3.60.
Original post by Marubozu from My Stocks Investing Journey.
Starhub Fundamental Data
| Current P/E Ratio (ttm) | 19.3503 |
|---|---|
| Estimated P/E(12/2014) | 18.7838 |
| Relative P/E vs. FSSTI | 1.5094 |
| Earnings Per Share (SGD) (ttm) | 0.2155 |
| Est. EPS (SGD) (12/2014) | 0.2220 |
| Est. PEG Ratio | 3.9503 |
| Market Cap (M SGD) | 7,176.74 |
| Shares Outstanding (M) | 1,721.04 |
| 30 Day Average Volume | 1,376,467 |
| Price/Book (mrq) | 87.4236 |
| Price/Sale (ttm) | 3.0630 |
| Dividend Indicated Gross Yield | 4.80% |
| Cash Dividend (SGD) | 0.0500 |
| Dividend Ex-Date | |
| 5 Year Dividend Growth | 2.13% |
| Next Earnings Announcement | 05/09/2014 |