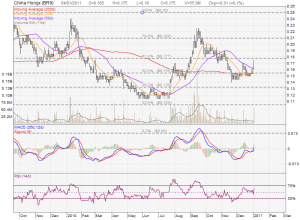
China HongXing moves above all 3 Moving Averages today. Other bullish technical signs are observed too:
- 20D MA starts to head up to cross 50D MA.
- RSI and Stochastic starts heading north.
- MACD starts to get bullish signal.
- Stock Price is on top of Parabolic SAR.
- Stock Price at the upper Bollinger Band.
China HongXing finds a good support at 200D MA at about $0.155. Everything looks good but now the only thing is to closely observe whether there is enough sustainable trading volume to kick the bull to run!


Hi Maru.
Gut feel, do you think this is worth investing based on tech charts ? I am also considering.. Will you be able to post a updated chart overview based on end of today ? Just wanna see if the chart of MACD 26d/12d has crossed over yet ..
Btw, what charting software do u use ? Thanks for your advice.
ed
Hi ed,
I don’t plan long term investing on China HongXing because the fundamental does not meet my investing criteria.
Currently HongXing may be forming a Flag Pole or Pennant pattern. Base on past chart patterns, this stock may be running up with a few Flag poles or pennants. Do take note that MACD & other technical indicators are lagging indicators, I don’t use them to decide entry or exit. I analyse chart patterns and study the support / resistance to give me a rough idea where is a good entry and exit points, and then confirmed by the technical indicators.
You can download the free software from ChartNexus. 3 years fee data is available but you need to pay for more data.
Marubozu
Wow! Someone bought 10 million shares at $0.175 mid day and closed at $0.185 today… Volume is coming!
Well well well! Would it be too late for us to follow the trend?
TAN, are you investing or trading?
If you are investing, then you may need to wait for pull back.
If you are trading, you may be a bit late base on technical indicators (all bullish now) but they are the lagging indicators. A better way is to look at chart pattern (support and resistance) to prepare for entry instead of technical indicators. However, you still can chase if you want to, but the risk is higher.
Marubozu
Marubozu,
How do you know that the 10 million shares was from a single buyer? Where do you get that info from?
Lim, you can check “Times and Sales” from your online stock trading or shareinvestor.
There is one single transaction with 10,000 lots.
I see.
Thanks.
Doesn’t look like the bull is coming…