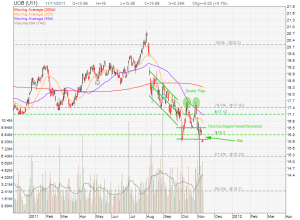
UOB failed to form a “Higher High, Higher Low” uptrend pattern as per last analysis. The stock formed a Double Tops at about $17.60 instead and reversed to down trend since then. UOB also failed to break the neckline resistance after showing a Hammer candlestick. The stock also had a gap down and break below $16.00 support. If UOB cannot close the gap in the next few days, the stock will trade in the down trend heading towards the next 61.8% Fibonacci support of $15.23. All 3 Moving Averages (20D, 50D and 200D) are heading down. The Moving Average (2W, 4W and 12W) are also heading down in the Weekly chart.
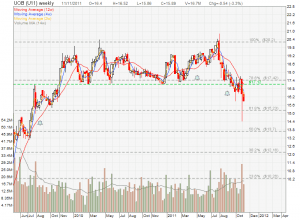
Extended chart to show $17.1 is the tough support turned resistance.
Does UOB hold S$608 mln worth of Greek debt securities?


