
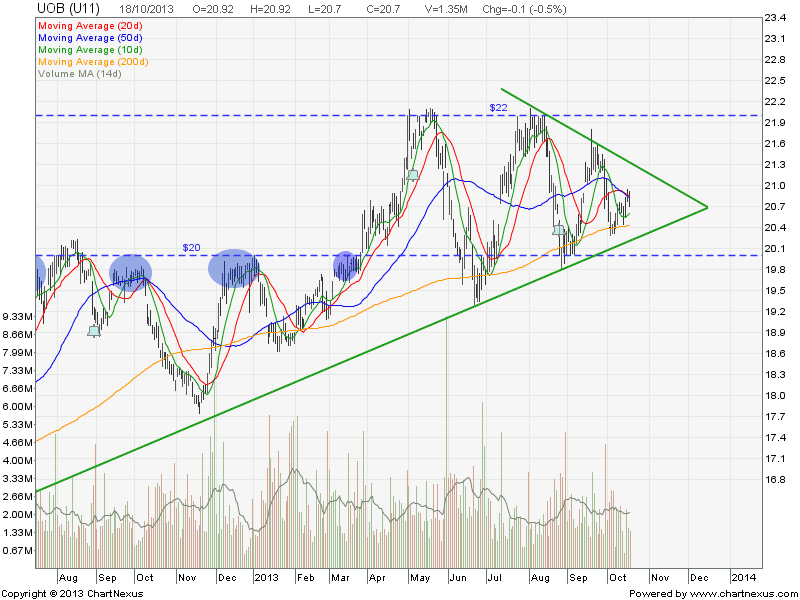
UOB Bank is currently consolidating in a Symmetrical Triangle. Nothing to trade at the moment.
Original Post by Marubozu @ My Stocks Investing Journey.
Key Statistics for UOB
| Current P/E Ratio (ttm) | 11.5966 |
|---|---|
| Estimated P/E(12/2013) | 11.7480 |
| Relative P/E vs. FSSTI | 0.8858 |
| Earnings Per Share (SGD) (ttm) | 1.7850 |
| Est. EPS (SGD) (12/2013) | 1.7620 |
| Est. PEG Ratio | 2.2305 |
| Market Cap (M SGD) | 32,607.34 |
| Shares Outstanding (M) | 1,575.23 |
| 30 Day Average Volume | 1,992,752 |
| Price/Book (mrq) | 1.3789 |
| Price/Sale (ttm) | 3.7875 |
| Dividend Indicated Gross Yield | 2.90% |
| Cash Dividend (SGD) | 0.2000 |
| Dividend Ex-Date | 08/26/2013 |
| 5 Year Dividend Growth | 1.49% |
| Next Earnings Announcement | 11/05/2013 |