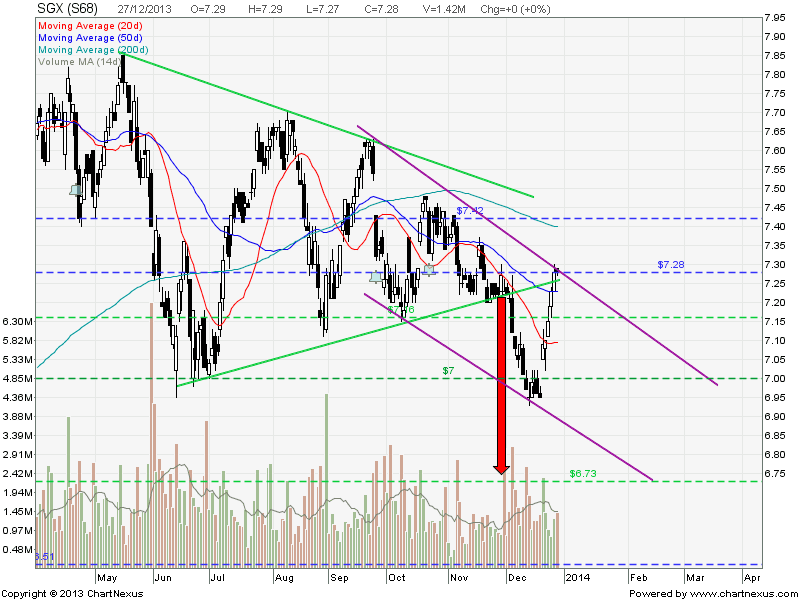
City Development breakdown from a Descending Triangle. Currently City Development rebound and retest the Triangle support turned resistance. Failing to move above $9.72 will confirm the breakout with price target of $8.25.
City Development is on the confirmed long term down trend as 200D SMA is sloping down. A “Lower Low, Lower High” down trend pattern has also been formed.

Original Post by Marubozu @ My Stocks Investing Journey
| Current P/E Ratio (ttm) |
12.5000 |
| Estimated P/E(12/2013) |
15.0235 |
| Relative P/E vs. FSSTI |
0.9319 |
| Earnings Per Share (SGD) (ttm) |
0.7680 |
| Est. EPS (SGD) (12/2013) |
0.6390 |
| Est. PEG Ratio |
2.4657 |
| Market Cap (M SGD) |
8,729.29 |
| Shares Outstanding (M) |
909.30 |
| 30 Day Average Volume |
753,633 |
| Price/Book (mrq) |
1.2000 |
| Price/Sale (ttm) |
2.6662 |
| Dividend Indicated Gross Yield |
0.83% |
| Cash Dividend (SGD) |
0.0800 |
| Dividend Ex-Date |
08/13/2013 |
| 5 Year Dividend Growth |
0.98% |
| Next Earnings Announcement |
02/28/2014 |