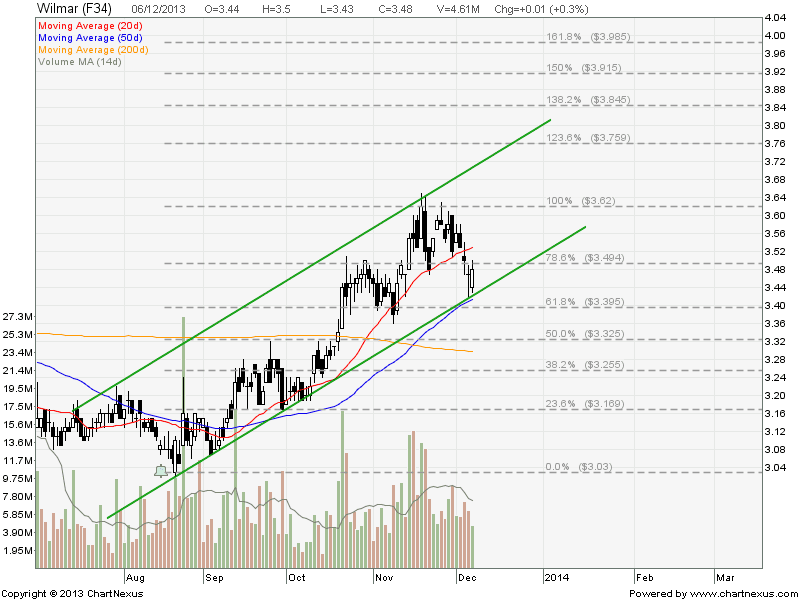
Wilmar: Rebound!

  • Post author:

Wilmar looks like rebounding after retracing back to uptrend channel support. $3.40 is also the 50D SMA support and also the 61.8% Fibonacci Retracement level. Expect rebound from here with medium term price target of about $4.00 (161.8% FR) as long as Wilmar continues to stay within this up trend channel.

2013Dec8-Wilmar

See previous analysis on Wilmar.

Key Statistics for WIL

Current P/E Ratio (ttm) 12.4893
Estimated P/E(12/2013) 13.5783
Relative P/E vs. FSSTI 0.9383
Earnings Per Share (USD) (ttm) 0.2230
Est. EPS (USD) (12/2013) 0.2050
Est. PEG Ratio 1.3312
Market Cap (M SGD) 22,268.79
Shares Outstanding (M) 6,399.08
30 Day Average Volume 7,207,967
Price/Book (mrq) 1.2120
Price/Sale (ttm) 0.4041
Dividend Indicated Gross Yield 1.58%
Cash Dividend (SGD) 0.0250
Dividend Ex-Date 08/16/2013
5 Year Dividend Growth 0.37%
Next Earnings Announcement 02/21/2014

Continue ReadingWilmar: Rebound!

City Development: Doji! Watch Rebound!

  • Post author:

City Development showed a doji candle near the Descending Triangle support. Watch for reversal pattern for a quick long trade with price target $10.00-$10.20 (Triangle resistance). City Development chart is technically bearish. Keep stop loss tight.

See previous analysis on City Development.

2013Dec8-CITYDEV-800x600

Key Statistics for CIT

Current P/E Ratio (ttm) 12.7604
Estimated P/E(12/2013) 15.3365
Relative P/E vs. FSSTI 0.9587
Earnings Per Share (SGD) (ttm) 0.7680
Est. EPS (SGD) (12/2013) 0.6390
Est. PEG Ratio 2.5171
Market Cap (M SGD) 8,911.15
Shares Outstanding (M) 909.30
30 Day Average Volume 630,533
Price/Book (mrq) 1.2250
Price/Sale (ttm) 2.7217
Dividend Indicated Gross Yield 0.82%
Cash Dividend (SGD) 0.0800
Dividend Ex-Date 08/13/2013
5 Year Dividend Growth 0.98%
Next Earnings Announcement 02/28/2014
Continue ReadingCity Development: Doji! Watch Rebound!

Starhub: Start Down Trend?

  • Post author:

Starhub looks like breaking out from a Rising Wedge and start trading in a down trend channel. Starhub recently retested 200D SMA resistance but failed. Price target is $3.90 if this breakout is successful. The chart is bearish as Starhub is trading below all 3 moving averages.

2013Dec8-StarHub-800x600

See previous analysis for Starhub.

Key Statistics for STH

Current P/E Ratio (ttm) 19.1548
Estimated P/E(12/2013) 19.2166
Relative P/E vs. FSSTI 1.4391
Earnings Per Share (SGD) (ttm) 0.2177
Est. EPS (SGD) (12/2013) 0.2170
Est. PEG Ratio 3.5652
Market Cap (M SGD) 7,170.46
Shares Outstanding (M) 1,719.53
30 Day Average Volume 1,807,833
Price/Book (mrq) 86.4763
Price/Sale (ttm) 2.9880
Dividend Indicated Gross Yield 4.80%
Cash Dividend (SGD) 0.0500
Dividend Ex-Date 11/13/2013
5 Year Dividend Growth 2.13%
Next Earnings Announcement 02/07/2014
Continue ReadingStarhub: Start Down Trend?