Singapore REIT Fundamental Analysis Comparison Table – 9 Nov 2013

  • Post author:

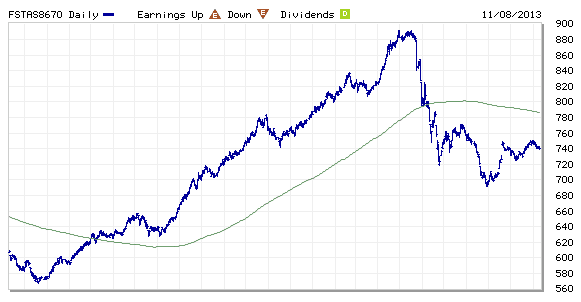
FTSE ST Real Estate Investment Trusts (FTSE ST REIT) Index changes from 735.74 to 740.76 compare to last post on Singapore REIT Fundamental Comparison Table on Oct 12, 2013. The index is still trading below 200D SMA and technically bearish. However, there is sign of potential reversal if the index break the recent high of 750 as it will be forming an Inverted Head and Shoulders, a reversal chart pattern. Currently the index has moved out from the down trend channel and trading sideway. 750 is the resistance to watch. Fundamentally there is still a fear of interest hike in near future which dampen the investment sentiment in REIT.

FTSE ST REIT Index Nov8-2013

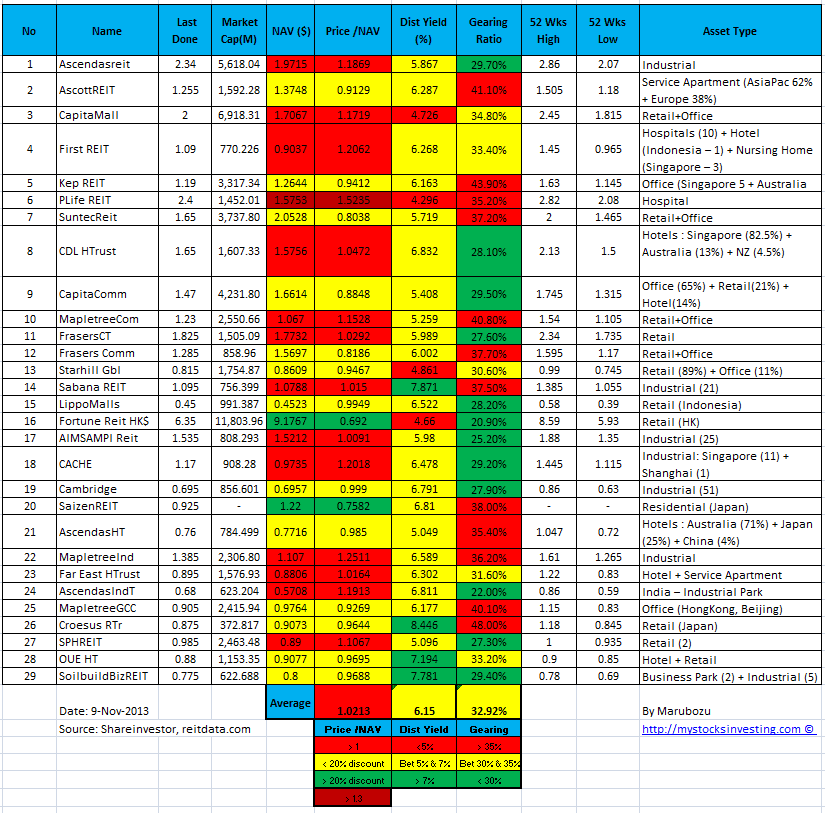
Compare to last Singapore REIT comparison table:

  • Price/NAV increases from 1.018 to 1.0213.
  • Dividend Yield decreases from  6.23% to 6.15%.
  • Gearing Ratio reduced from 33.07% to 32.92%.
  • In general, Singapore REIT is at the Fair Value and the distribution yield is reasonable. However technically Singapore REIT is in the bearish territory and in consolidation phase. So do not expect any big stock price upward movement for capital gain.  The uncertainty in term of interest hike in near future remains high and this causes limited upside potential for Singapore REITs or even wipe out your initial capital invested in REIT. Invest safe and this is not the time to be hero in REIT investing until the cloud is clearer. More importantly investors must know how to GET OUT if the charts turn bearish and start another down trend again.

Singapore REIT NAV Gearing Distribution Yield Comparison Table 9-Nov-2013


Find out how do I conduct research on Singapore REIT, how to interpret those financial ratio in the comparison table, when is the best time to buy using simple Trend Analysis. Furthermore it is important to understand the BIGGER TREND so that your investment will not be losing money in the down trend market. Find out WHERE and HOW to read the FTSE ST Real Estate Investment Trust Index because timing is very critical in making any investment decision.  Check out my next public tutorial on  “How to pick Singapore REIT for Dividend Investing” .

Continue ReadingSingapore REIT Fundamental Analysis Comparison Table – 9 Nov 2013

Noble Group: Bull is back!

  • Post author:

All signs are showing Noble Group is going to start a bullish uptrend.

  • Noble Group has cleared the previous support turned resistance of Descending Triangle of $1.04.
  • Noble Group has cleared the 200D SMA resistance and trading above all the 3 Moving Averages.
  • Noble Group is trading in an uptrend channel.
  • Morning Doji Star (or Bullish Abandoned Baby) rebounded at up trend channel support and 100% FR support.
  • Noble Group is fitting the Fibonacci Retracement Level (0%, 61.8%, 100%, 161.8%) very nicely.
  • Noble Group will be heading towards 261.8% Fibonacci Retracement level at about $1.25 IF
    • Stay above $1.04 and this becomes a reliable support.
    • Clear $1.06 resistance (161.8% FR)
    • Uptrend still intact (higher high, higher low)

However, the whole bullish scenario will be void if Noble Group goes below $1.04 and the 200D SMA become resistance.

2013Nov6-Noble Group


Original analysis by Marubozu @ My Stocks Investing Journey.

WATCH OUT Earning release on Nov 12, 2013.

Key Statistics for NOBL

Current P/E Ratio (ttm) 23.5758
Estimated P/E(12/2013) 15.1685
Relative P/E vs. FSSTI 1.7251
Earnings Per Share (USD) (ttm) 0.0360
Est. EPS (USD) (12/2013) 0.0560
Est. PEG Ratio 1.0112
Market Cap (M SGD) 6,991.81
Shares Outstanding (M) 6,627.31
30 Day Average Volume 26,622,270
Price/Book (mrq) 1.0964
Price/Sale (ttm) 0.0578
Dividend Indicated Gross Yield 2.13%
Cash Dividend (USD) 0.0181
Dividend Ex-Date 05/14/2013
5 Year Dividend Growth 0.53%
Next Earnings Announcement 11/12/2013
Continue ReadingNoble Group: Bull is back!

Global Stock Market Indices PE Ratio At a Glance – 4 Nov 2013

  • Post author:

Market Indices PE Ratio for Major Stock Exchange globally.

Average PE ratio increases from 18.42 to 18.70.

Oct 2013 Month Global PE Ratio.

  • US: Dow Jones Industrial, S&P500, NASDAQ, Russell 2000
  • Europe: FTSE100, CAC40, DAX
  • Asia: KLCI, STI, HangSeng, ASX200, CSI 300, JCI, SET, KOPSI, NIKKEI 225, SENSEX, TWSE, NZX50, PSEi

Stock Market Key Indices PE Ratio Nov4-2013


Find out how to interpret whether the stock market is over value or under value base on PE ratio for your investing decision at Fundamental Analysis class. Educate yourself to understand more about stock market and financial knowledge first before venturing into stock market.


Continue ReadingGlobal Stock Market Indices PE Ratio At a Glance – 4 Nov 2013