Lippo Mall Indonesia Retail Trust Fundamental & Technical Analysis

  • Post author:

Fundamental Analysis

  • Last Price = $0.445
  • NAV = $0.5654
  • Price / NAV = 0.7871 (Under Value)
  • Distribution Yield = 6.595%
  • Gearing Ratio = 24.2% (Low Gearing)
  • Weighted Average Debt Maturity = 2.3 Years
  • Total Portfolio Occupancy Rate = 95.1%
  • WALE = 5.1 Years

Lippo Mall Indonesia Retail Trust (LMIR Trust) 2Q 2013 Result Presentation.


Technical Analysis

Lippo Mall is technically bearish (below 200D SMA) and currently seems like trading within a down trend channel. Currently the stock price is testing the down trend channel resistance at about $0.44.  If rejected at this resistance and break the recent support of $0.425, Lippo Mall will continue the down trend.

Lippo Malls Oct11-2013


See Singapore REIT Comparison Table here.


Continue ReadingLippo Mall Indonesia Retail Trust Fundamental & Technical Analysis

Singapore REIT Fundamental Analysis Comparison Table – 12 Oct 2013

  • Post author:

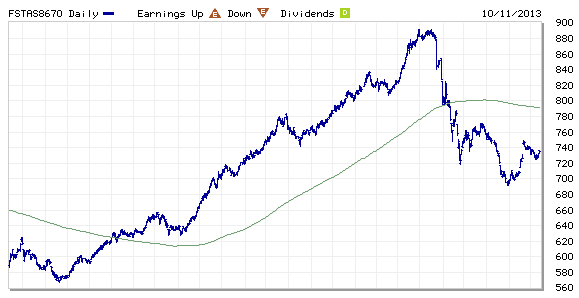
FTSE ST Real Estate Investment Trusts (FTSE ST REIT) Index changes from 699.17 to 735.74 compare to last post on Singapore REIT Fundamental Comparison Table on Sept 6, 2013. The index is still trading below 200D SMA and technically bearish. However, there is sign of potential reversal if the index break the recent high of 750 as it will be forming an Inverted Head and Shoulders, a reversal chart pattern. Alternatively, the index will continue the down trend if rejected at the down trend channel resistance at about 740.

FTSE ST REIT Index Oct11-2013

Compare to last Singapore REIT comparison table:

  • Price/NAV increases from 0.9763 to 1.018.
  • Dividend Yield decreases from  6.41% to 6.23%.
  • Gearing Ratio remains the more or less the same at 33.07%.
  • In Short, some Singapore REIT become attractive in terms of valuation and distribution yield again. However technically Singapore REIT is still on down trend and the price can go even lower although fundamental looks attractive. Stock picks are important and have to be selective base on fundamental and technically analysis. The uncertainty in term of interest hike in near future remains high and this causes limited upside potential for Singapore REITs.

Singapore REIT NAV Gearing Distribution Yield Comparison Table 11-Oct-2013


Bubble Chart (Distribution Yield vs Price/NAV) – Value for Money

Singapore REIT Bubble Chart (Value) Oct11-2013


Bubble Chart (Gearing Ratio vs Price/NAV) – Risk Avoidance

Singapore REIT Bubble Chart (Risk) Oct11-2013

Compare to last Bubble Charts here.

Find out how do I conduct research on Singapore REIT, how to interpret those financial ratio in the comparison table, when is the best time to buy using simple Trend Analysis. Furthermore it is important to understand the BIGGER TREND so that your investment will not be losing money in the down trend market. Find out WHERE and HOW to read the FTSE ST Real Estate Investment Trust Index because timing is very critical in making any investment decision.  Check out my next public tutorial on  “How to pick Singapore REIT for Dividend Investing” .

Continue ReadingSingapore REIT Fundamental Analysis Comparison Table – 12 Oct 2013

First REIT: Fundamental & Technical Analysis

  • Post author:

Fundamental Analysis

  • Last Price = $1.105
  • NAV = $0.895
  • Price / NAV = 1.2346
  • Distribution Yield = 6.195%
  • Gearing Ratio = 33.4%
  • Plus Points: Rental pegged at SGD and USD & Long Master Lease.
  • Minus Point: Gearing at the high side.

FIRST REIT last presentation at Macquarie ASEAN Conference on Aug 28, 2013.

Technical Analysis

First REIT is technically bearish (below 200D SMA) and currently seems like trading within a down trend channel. Currently the stock price is testing the down trend channel resistance. If rejected at this resistance and break the recent support of $1.06, First REIT will continue the down trend.

2013Oct12-FirstREIT-800x600

See Singapore REIT Comparison Table here.

Continue ReadingFirst REIT: Fundamental & Technical Analysis