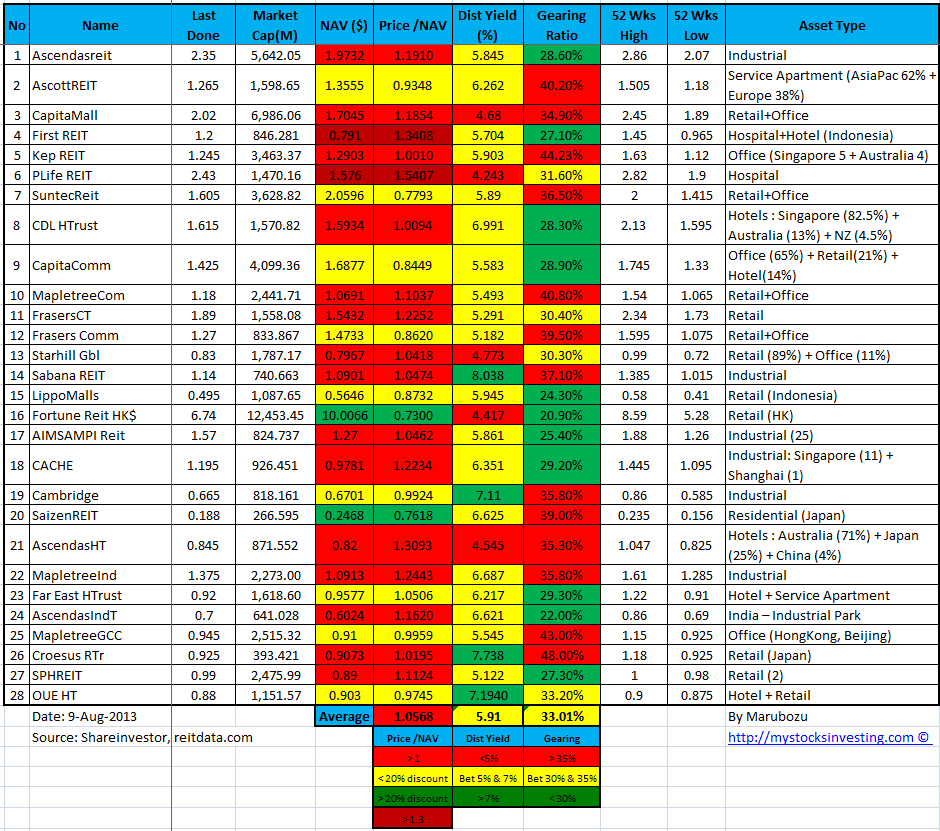
Singapore REIT Fundamental Analysis Comparison Table – 9 Aug 2013 (Singapore National Day)
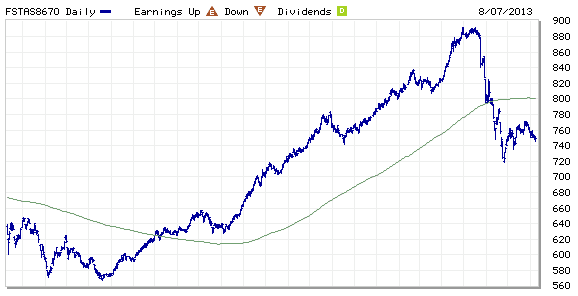
FTSE ST Real Estate Investment Trusts (FTSE ST REIT) Index changes from 767.53 to 749.17 compare to last post on Singapore REIT Fundamental Comparison Table on July 26, 2013. The index is trading below 200D SMA and technically bearish. Looks like the index also breaks the recent rebound uptrend support line and may start Elliott Wave C (down!!).
 Compare to last SREIT comparison table:
- Price/NAV decreases from 1.086 to 1.0568.
- Dividend Yield increases from 5.78% to 5.91%.
- Gearing Ratio remains the same at 33.01%.
Bubble Chart (Distribution Yield vs Price/NAV) – Value for Money

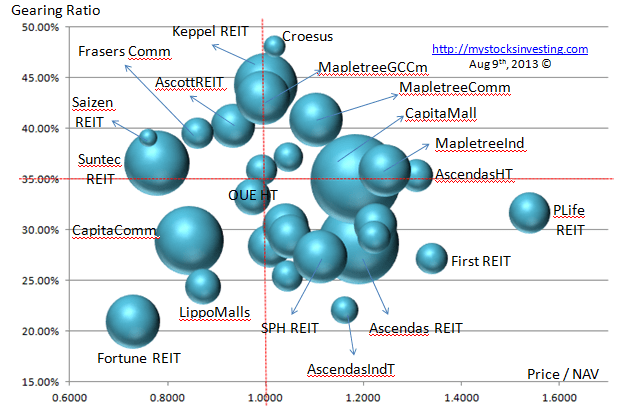
Bubble Chart (Gearing Ratio vs Price/NAV) – Risk Avoidance
 Find out how I do research on Singapore REIT, how to interpret those financial ratio in the comparison table, what opportunities can you find and what REITs should you avoid from the Bubble Charts, plus when to buy & when to sell using simple Trend Analysis. Check out my next public tutorial on “How to pick Singapore REIT for Dividend Investing” .