ST Engineering Rebound! Is It Time To Buy?

  • Post author:

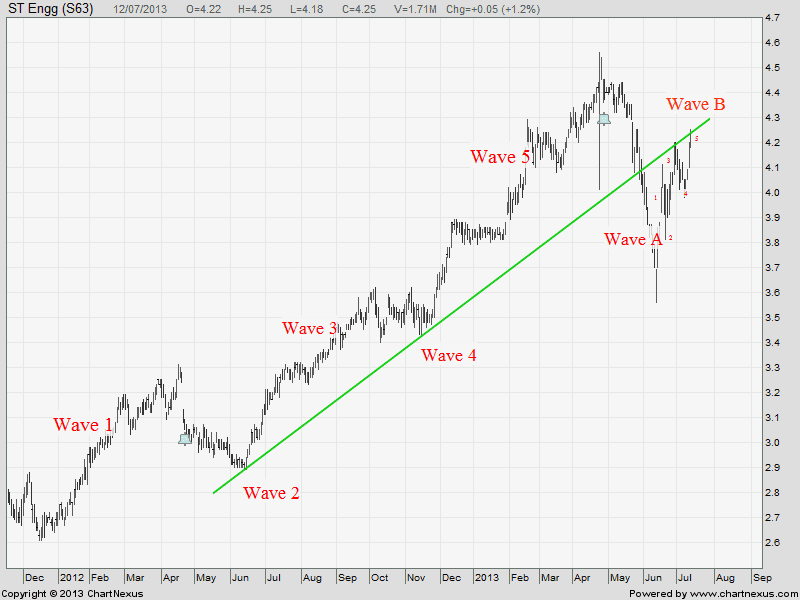
I have to re-draw the Elliott Wave count for ST Engineering because the recent rebound is still the Wave B. There is also a Mini Elliott Wave in Wave B (1-2-3-4-5) and currently hitting the uptrend support turned resistance level (green line).

For those who know Elliott Wave pattern and know how to count the Wave (1-2-3-4-5-A-B-C), you should be able to identify what is the next move! It is Wave C of the Big One and Wave A for the Small One! The Big and The Small are in the same direction!  Now we just need to wait for the certain candlestick pattern to form! Happy Trading!

See last Elliott Wave count drawn for ST Engineering.

2013July12-ST Engg-800x600

Continue ReadingST Engineering Rebound! Is It Time To Buy?

OCBC Bank: Trend Reversal

  • Post author:

OCBC breakout from a Symmetrical Triangle and rebounded from the uptrend channel support (also the 38.2% FR level). The down trend is officially ended which this breakout. The minimum price target of this symmetrical triangle breakout is $10.50. As there are no clear significant resistance, the next immediate will base on the Fibonacci Retracement Level.

2013Jul11-OCBC Bk-800x600


Key Statistics for OCBC

Current P/E Ratio (ttm) 9.5142
Estimated P/E(12/2013) 13.3935
Relative P/E vs. FSSTI 0.7293
Earnings Per Share (SGD) (ttm) 1.0910
Est. EPS (SGD) (12/2013) 0.7750
Est. PEG Ratio 1.9319
Market Cap (M SGD) 35,617.86
Shares Outstanding (M) 3,431.39
30 Day Average Volume 5,356,500
Price/Book (mrq) 1.5041
Price/Sale (ttm) 4.2132
Dividend Indicated Gross Yield 3.18%
Cash Dividend (SGD) 0.1700
Last Dividend 04/29/2013
5 Year Dividend Growth 3.34%
Next Earnings Announcement 08/02/2013
Continue ReadingOCBC Bank: Trend Reversal