Singapore REITs Comparison Table for Dividend Investing as Passive Income – June 2013

  • Post author:

Finally Singapore REIT started selling off and SREIT P/B drops from 1.22 to 1.12. Is it good time to get in now as what The Straits Times (June 1, 2013) suggested? Personally I have cleared all my REIT portfolio and wait for a good opportunity for Great Singapore Sales. However I don’t think this is the right time to get in yet base on 3 reasons:

  • Fundamentally the current REIT is NOT cheap and still over value base on NAV.
  • Technically most REIT has broken the uptrend support and starting a bearish trend.
  • Distribution yield will drop if there is increase in interest rate.

StraitsTime Jun12013

 Added Croesus Retail Trust.

Singapore REIT stock comparison 1-June-2013

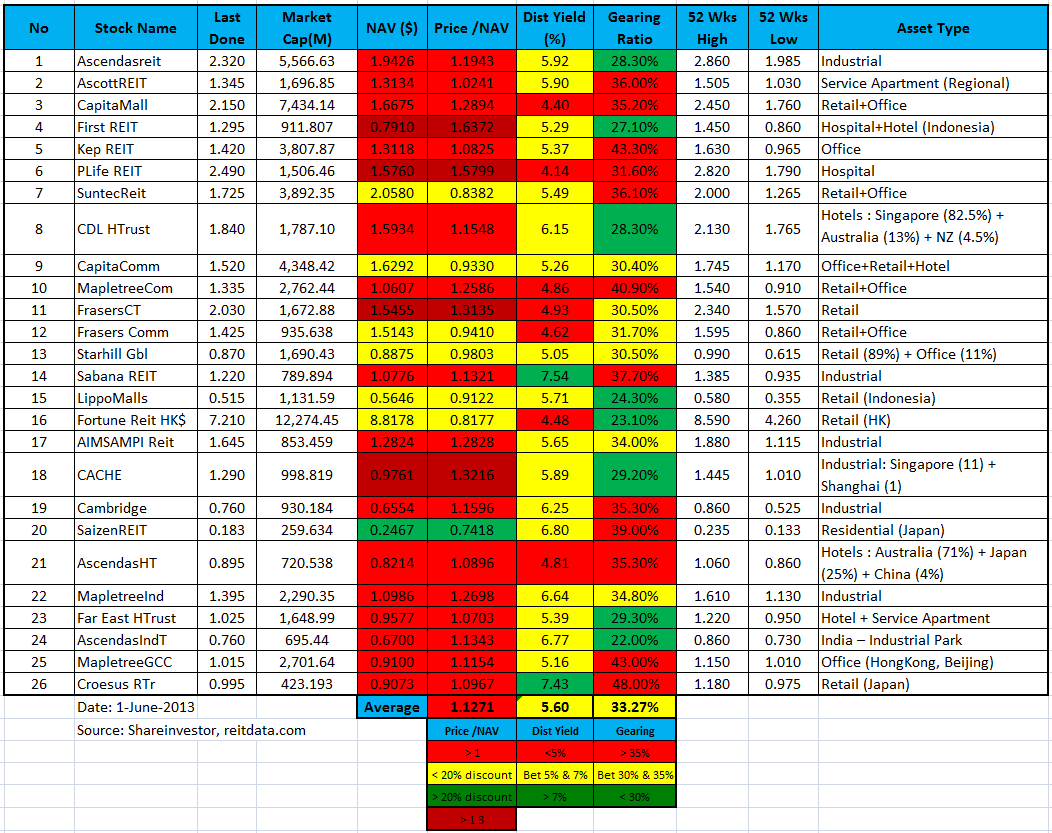
Compare to last month SREIT comparison table:

  • Price/NAV decreases from 1.22 to 1.12.
  • Dividend Yield increases from 4.97% to 5.6%
  • Gearing Ratio increases from 32.92% to 33.27%

Doing Fundamental Analysis of Singapore REIT is relatively easier than stock. If you are interested to learn how to do research on Singapore REIT and also time the entry / exit by learning the simple Trend Analysis, you may want to check out my 1st public tutorial “How to pick Singapore REIT for Dividend Investing” .

Disclaimer applied. I am NOT a certified Financial Advisor and NOT making any Buy or Sell recommendation. The above article is just my OWN analysis and PERSONAL opinion.

Continue ReadingSingapore REITs Comparison Table for Dividend Investing as Passive Income – June 2013

Capitaland: Elliott Wave C Down?

  • Post author:

Could the recent rebound of Capitaland has ended and found the recent top at $3.85? If yes, it looks like Capitaland is trading in a Elliott Wave C now.

A few things to watch:

  • $3.66 is the recent support. It may be forming a Head and Shoulder with neckline at $3.66. 
  • $3.60 support.
  • 50D SMA support which use to be a reliable support base on recent pattern.
  • 200D SMA support.
  • $3.40 support (61.8% Fibonacci Retracement Level). Breaking this support will confirm the Wave C, also confirm the down trend for Capitaland.

2013May26-Capitaland-800x600

Key Statistics for CAPL

Current P/E Ratio (ttm) 15.7759
Estimated P/E(12/2013) 20.7955
Relative P/E vs. FSSTI 1.1373
Earnings Per Share (SGD) (ttm) 0.2320
Est. EPS (SGD) (12/2013) 0.1760
Est. PEG Ratio 0.4905
Market Cap (M SGD) 15,581.79
Shares Outstanding (M) 4,257.32
30 Day Average Volume 11,473,200
Price/Book (mrq) 1.0133
Price/Sale (ttm) 4.6834
Dividend Indicated Gross Yield 1.91%
Cash Dividend (SGD) 0.0700
Last Dividend 05/03/2013
5 Year Dividend Growth -10.84%
Next Earnings Announcement 08/01/2013
Continue ReadingCapitaland: Elliott Wave C Down?

Lippo Mall Indo Retail Trust Chart and Technical Analysis

  • Post author:
  • LMIR is just sitting on the uptrend line support level at about $0.53. This level is also the 50D SMA and also the previous resistance. Breaking this support may send LMIR to 200D SMA at about $0.49.
  • Resistance at $0.58.
  • Take note of the spike in selling volume.
  • Upside potential (to next resistance) = 9.4%
  • Downside risk (to next support) = 7.5%
  • If this support holds, may be good entry level to buy on dip because LMIR is still on uptrend, and fundamental is still undervalue base on NAV with good distribution yield.

LMIR May23-2013


LMIR Fundamental Analysis.

Continue ReadingLippo Mall Indo Retail Trust Chart and Technical Analysis