Singapore REITs Comparison Table for Dividend Investment – May 2013

  • Post author:

Marked BUBBLE in black! Amazingly people is willing to overpay > 70% of the value to invest in First REIT and Parkway Life REIT.

Singapore S-REIT stock comparison table 2May-2013

Compare to last month SREIT comparison table:

  • Price/NAV increases from 1.20 to 1.22
  • Dividend Yield drops from 5.34% to 4.97%
  • Gearing Ratio drops from 33.15% to 32.92%

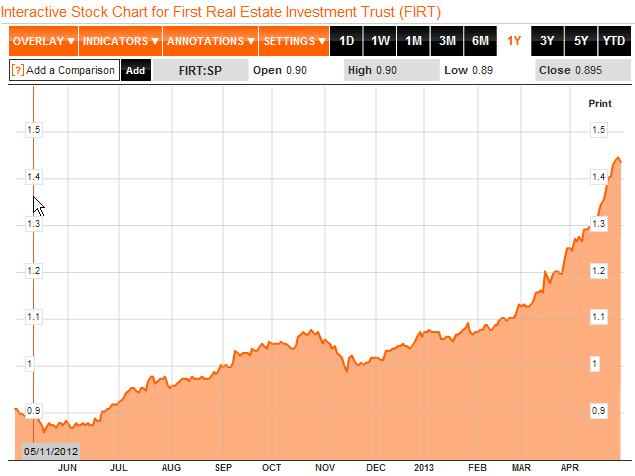
First REIT chart shows Parabolic Curve.

First REIT May2-2013


Parkway REIT is at almost historical high.

Parkway REIT May2-2013


Doing Fundamental Analysis of Singapore REIT is relatively easier than stock. If you are interested to learn how to do research on Singapore REIT and also time the entry / exit by learning the simple Trend Analysis, you may want to check out my 1st public tutorial “How to pick Singapore REIT for Dividend Investing” .


Continue ReadingSingapore REITs Comparison Table for Dividend Investment – May 2013

Singapore Exchange (SGX): Start Down Trend?

  • Post author:

Singapore Exchange breakout from the Rectangle after XD date. The rebound from $7.40 was rejected by the 20D SMA (note: 20D SMA is quite a reliable support & resistance for SGX base on past pattern).  The recent support of $7.41 is the critical support to watch. Breaking this support will send SGX to the price target of about $7.175 (the 200D SMA & 161.8% FR).

Past analysis on SGX.

2013Apr30-SGX

Continue ReadingSingapore Exchange (SGX): Start Down Trend?

SGX: Range Bound for Now

  • Post author:

Singapore Exchange (SGX) is currently trading within a range between $7.55 and $7.84. Fundamentally I don’t see any strong catalyst for SGX to break the resistance at $7.84 to move higher. I will be watching the $7.55 support and short SGX if the support is broken. Both 20D and 50D SMA are currrently moving sideway and flat.

Watch SGX stock price movement after XD date.

2013April19-SGX

Key Statistics for SGX

Current P/E Ratio (ttm) 26.6728
Estimated P/E(06/2013) 25.0649
Relative P/E vs. FSSTI 1.9942
Earnings Per Share (SGD) (ttm) 0.2894
Est. EPS (SGD) (06/2013) 0.3080
Est. PEG Ratio 3.7692
Market Cap (M SGD) 8,253.93
Shares Outstanding (M) 1,069.16
30 Day Average Volume 1,601,000
Price/Book (mrq) 10.3357
Price/Sale (ttm) 12.3545
Dividend Indicated Gross Yield 3.50%
Cash Dividend (SGD) 0.0400
Last Dividend 04/22/2013
5 Year Dividend Growth -6.61%
Next Earnings Announcement 07/26/2013
Continue ReadingSGX: Range Bound for Now