Star Wars at Singapore Changi Airport
Star Wars in Singapore Changi Airport.


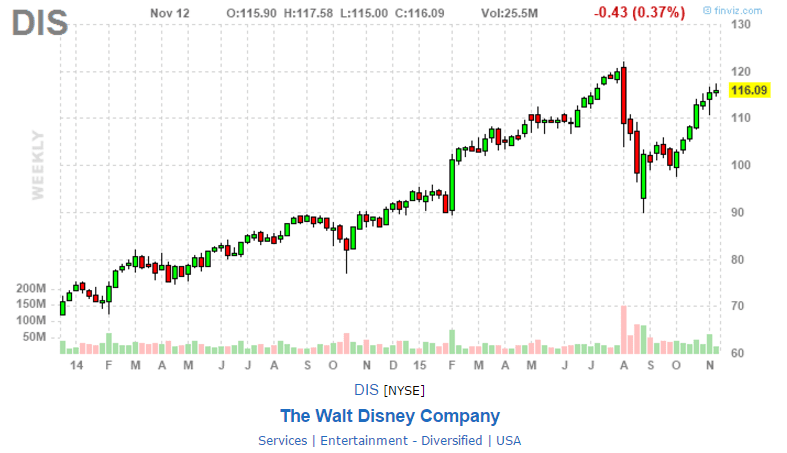
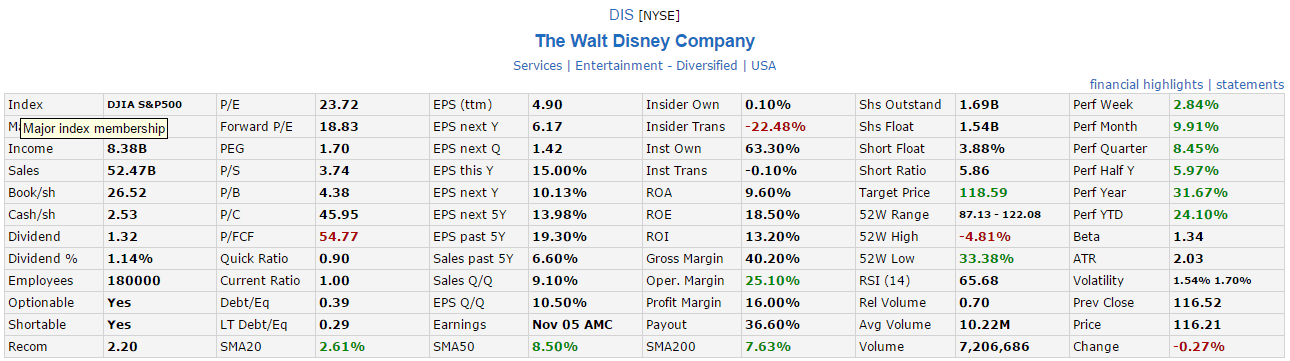
Watch Disney (DIS) stock price closely in December!
See Star Wars Trailer – The Force Awakens here.

Star Wars in Singapore Changi Airport.
Watch Disney (DIS) stock price closely in December!
See Star Wars Trailer – The Force Awakens here.
![]()
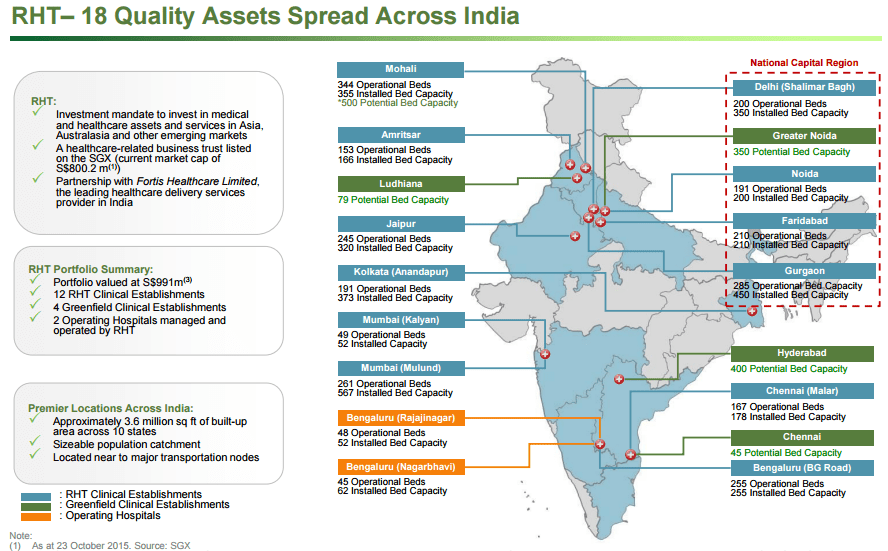
Religare Health Trust Quarterly Earning Result Nov 5, 2015
Singapore REITs Fundamental Analysis Comparison Table


Religare Health Trust Technical Analysis & Stock Chart

Religare Health Trust rebounded strongly and currently trading around the 200D SMA. There is limited upside potential as the stock price is trading near the historical high although the distribution yield and Price / NAV looks attractive. Three main risks to sustainability of DPU: Business Trust, Forex and Debt Profile.

Two other similar Healthcare related stocks are FIRST REIT and Parkway Life REIT to compare with Parkway Life REIT. Check out Singapore REIT Course here on how identify the RISKS of dividend sustainability of Singapore Healthcare REIT. https://mystocksinvesting.com/course/singapore-reits-investing/
![]()
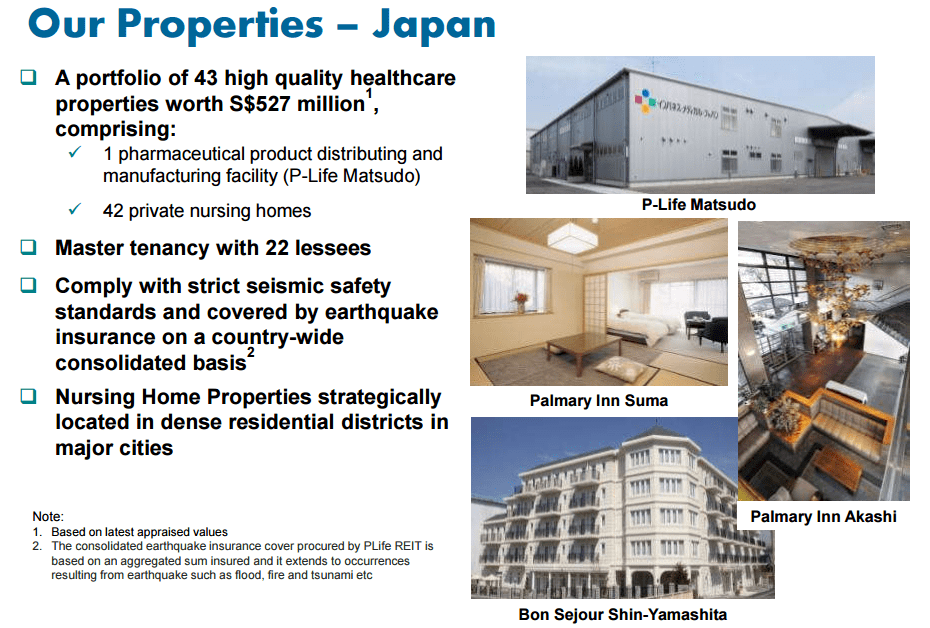
Parkway Life REIT 3Q 2015 Investor Presentation on Nov 5, 2015
Singapore REITs Fundamental Analysis Comparison Table

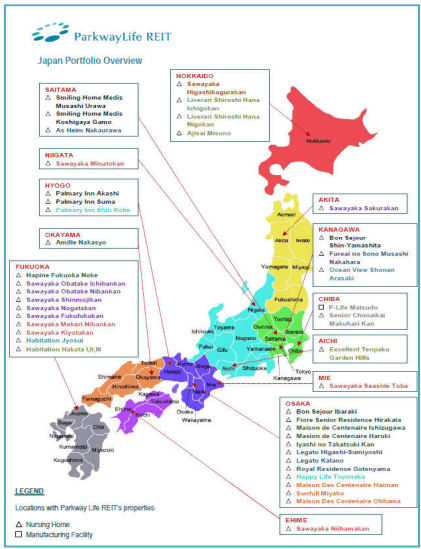


Parkway Life REIT Technical Analysis & Stock Chart
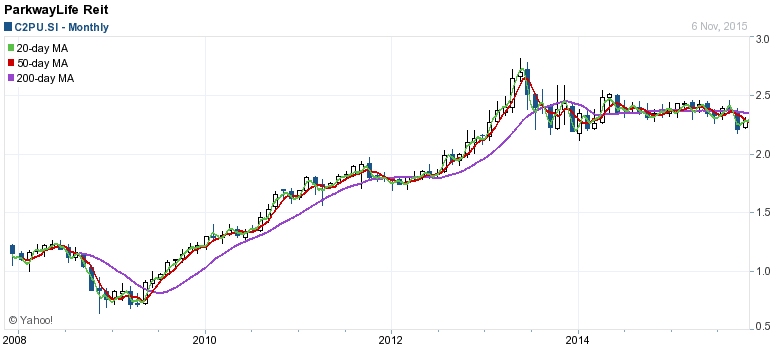
Parkway Life REIT is currently moving side way with limited upside potential base on the valuation (already 37.5% overvalue) and distribution yield below 6%. The yield is lower after fully payout of the divestment gain in next quarter.
FIRST REIT is another healthcare REIT to compare with Parkway Life REIT. Do you Due Diligence to compare the Fundamental of both healthcare REIT for Passive Income Investing. Healthcare REIT is defensive in nature and should be included into retail investors’ portfolio as the distribution income is more sustainable and predictable. However, it is important to know the entry price and entry timing otherwise we will lose out our initial invested capital.
Check out Singapore REIT Course here on how analyse the fundamental and dividend sustainability of Singapore Healthcare REIT. https://mystocksinvesting.com/course/singapore-reits-investing/