Copper: Hammer!
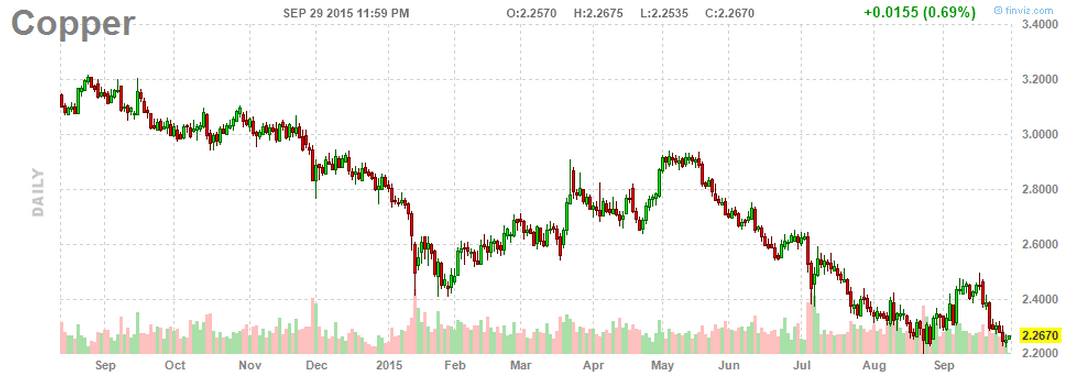
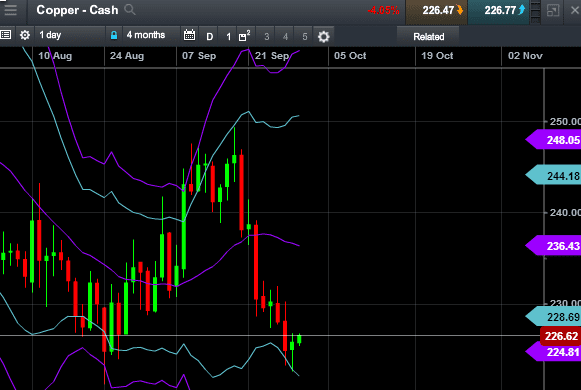
Copper has formed a Hammer at the support on daily chart. This is a potential reversal pattern for short term trade. Copper may be forming a Double Bottoms chart pattern after the recent down trend.

Copper has formed a Hammer at the support on daily chart. This is a potential reversal pattern for short term trade. Copper may be forming a Double Bottoms chart pattern after the recent down trend.
Raw Sugar is showing a Shooting Star candlestick at the Down Trend Channel Resistance. Potential short candidate with price target between $9.138 to $8.552.
Note: Candlestick reversal patterns are quite reliable in this Raw Sugar chart pattern. Observe carefully what trend reversal after Shooting Star, Hanging Man, Three Inside Down, Evening Star were found at the channel resistance.
 Original post from https://mystocksinvesting.com