How do I value a stock?

  • Post author:

There are 3 different methods of doing a stock valuation.

  • Simple Price / Earning (PE) Ratio & PEG
  • Discounted Cash Flow (DCF)
  • Discounted Earning Per Share (EPS)

Simple PE Ratio & PEG
As a general guideline, a company is at its fair value if the PE is about 15. If the PE ratio less than 15, it is considered under value, and vice versa. I also do a quick comparison of current PE versus the average PE historically. I will pay special attention to the stock price movement if the current PE is more higher than the historical PE average.

PEG refers PE ratio divided by company growth rate. PEG = 1 means that PE growth rate is the same as the company growth rate (measured by either EPS growth rate or net operating cash flow growth rate)

If PEG < 1, the stock price is under value.
If PEG > 1, the stock price is over value.
If PEG = 1, the stock price is at its fair value.

Discounted Cash Flow Model (DCF)
This model is to estimate the company next 10 years net operating cash flow (Future Value, FV) and re-calculate to the Present Value (PV), and add all ten years PV together. The intrinsic value can be calculated after dividing the total number of shares,. The assumption made is the company must be able to generate cash growth consistently with a CAGR (Compounded Annual Growth Rate) which computed from the past history of net operating cash flow.

Net Operating Cash Flow information can be found from the company annual reports, under the Cash Flow Statement.

Discounted Earning Per Share Model (EPS)
Similar to the DCF model, but this time Earning Per Share is being looked into. EPS information can be found at the Income Statement by getting the Net Earning number and divided by the total number of shares. By looking at the historical EPS, a CAGR for EPS growth can be calculated.

By bringing all the 10 years FV of EPS to PV, adding them together give an intrinsic value of the stock.

Valuation of a stocks need some financial background and need some practice. Two key areas to pay attention to:
(1) Where to find the information? All the financial statement can be found from the annual reports by going to the company web site. Another way is to get the summarised information from the website like Shareinvestor (for Singapore Stocks), Morningstar & MSN Money (for US Stocks)
(2) Understand the Financial Fundamental & Definitions like Present Value, Future Value, Discount Rate, CAGR and also practise how to use them. I use the financial calculator to calculate the CAGR and instrinsic value calculator to calculate the intrinsic value of the stocks. I got those simple software (formula in excel form) from my investment course.

I found that DCF model is a better model although it is a little more complicated because Cash Flow is not easily manipulated by the company accountant and cash is always easily be audited. If the company business model is solid, the net operating cash flow grows consistently every year. On the other hand, good EPS numbers do not mean the company is increasing the sales revenue and gaining competitive advantage to expand the market share. EPS can be manipulated easily as the company accountant can add whatever provision they want, using different amortization or depreciation method or using different revenue recognition method. Furthermore, the company can make the EPS more attractive by buying back shares, doing all sorts of cost cutting internally (like selling company fixed assets) to make the number looks nice.

After the intrinsic value is calculated, I compare the current stock price with the intrinsic value. If the current stock price is at least 20% discount to the intrinsic value, I will put the stocks in my watchlist and wait for the right time to buy. I will share in the next post on how I time my entry. 

Continue ReadingHow do I value a stock?

China HongXing & Jaya Holding – Another observations with one-lot trading!

  • Post author:

China HongXing & Jaya Holding shown one lotter trading today but ended with different results today. I summarised the similarities of one-lot trading for Raffles Education, China HongXing & Jaya Holding as below:

  1. All three stocks’ prices are testing their support levels.
  2. One-lot trading starts at about 10:00am and about 3:30pm (except Jaya ends at 2:30pm today). I guess the professionals monitor the 1st hour of market movement before entering the trade at 10:00am. At 3:30pm, the professionals summarize the trade sitution before deciding the next step (either to enter a big position or abandon the trade). Three different outcomes for Raffles Education, China HongXing and Jaya Holding. Raffles Education ended the day with one white long candle; China HongXing ended with a doji but with a preclose volume of 2337 lots (big fish!); Jaya Holding ended with a short black candle (no big fish at preclose).

China HongXing One Lot Trading Summary (Sept 18, 2009)
China HongXing is swinging inside the channel, the channel support is between $0.215 and $0.22. If the price does not break this support level, the channel and uptrend is still intact and the price may go up to $0.27 & $0.28.

The one lot trading started at 10:08am testing $0.225 and later $0.22 for the whole day.

The one lot trading ended at about 3:23pm and at the preclose one big fish bought 2337 lots to close the day. The price did not go up at the end of the day but it fullfilled my hypothesis that someone would enter big trade near the end of the trading session.
Jaya Holding One Lot Trading Summary (Sept 18, 2009)

Jaya Holding is testing its 20D MA support at $0.47.

The one-lot trading started at about 10am testing the support of $0.47 and ended at about 2:30pm at the level $0.465.
It looked like $0.47 support was not strong enough and the professionals stopped the testing at 2:30pm and abandoned the trade after all. There was no big entry at the end of the trading session. The stock price closed at $0.465.
 
Continue ReadingChina HongXing & Jaya Holding – Another observations with one-lot trading!

Raffles Education – What an interesting trading lesson today!

  • Post author:

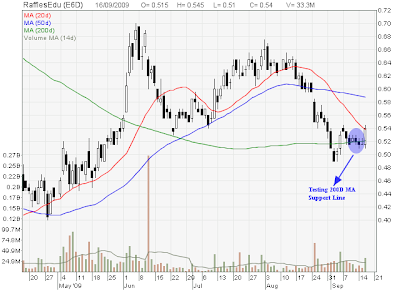
I have been waiting for opportunity to sell off my Raffles Education (PE ratio = 28) shares because I don’t feel comfortable holding this stock entering the historically most bearish month of the year. In addition, the stock price has been testing the $0.52 200D MA support line for a few days. Any breakdown of the support will start the down trend. Thus, I take a “Not to lose money” approach and wait for the price to go up to $0.525 (my entry point) to exit the position.

Coincidently I have a chance to catch an interesting trading session by some professional traders out there. I have been puzzled by why there are so many 1 lot selling out there every second and every minute for quite sometimes. I copied some transactions to illustrate my observations and tried to establish my own hypothesis. First of all, I don’t believe there are so many retail investors doing one lot transaction because the stock price has to move up by 5% to breakeven (to pay for the transaction commission). I was thinking that professional traders might try to test the support between $0.515 and $0.52 (200D MA at $0.52) before entering a big position by end of the day. I observed the trade every now and then to prove whether my hypothesis was right because this phenomenon was something very new and strange to me. From the early morning trade, there were one or two lots sold at $0.515. As soon as someone bought at $0.52 (50, 11, 10, 5), the stock price dropped back to $0.515 immediately (by 1 lot). Refer to Screen 1. Screen 2 showed all 1 lot transaction at $0.52 (about 10:30am) to check whether anyone was queuing at this price.

Screen 1
Screen 2
At about 3pm, the testing was between $0.515 and $0.52. The price went back immediately to $0.515 by 1 lot. Refer to Screen 3.
Screen 3
15 minutes later, the price moved up to $0.52 and I can see some genuine retail investors were buying up (100, 26, 92) and suddenly a 500 lots transaction shown up! Refer to Screen 4.
Screen 4
At this point, it looks like the support line between $0.515 and $0.52 is very strong and unlikely the stock price will breakdown to start the down trend. The BIG FISH finally appeared bought 2921 lots at $0.525. Refer to Screen 5. My stocks were already sold by the time I realised the stock price was moving up.
Screen 5
From this point onwards between 4:20pm and before the market closed, all the small fishes, medium fishes, big fishes were rushing in to close the price at $0.54 with one long white candle! Refer to Screen 6 & 7.
Screen 6
Screen 7
Although I lost an opportunity to sell at $0.54 but this interesting trade was an eye opener to me. It looks like my hypothesis was right and hopefully I can make full use of this lesson for future trade. I am going to check with my trainer tomorrow!
Continue ReadingRaffles Education – What an interesting trading lesson today!