Singapore REIT Bubble Chart: Value Selection & Risk Avoidance
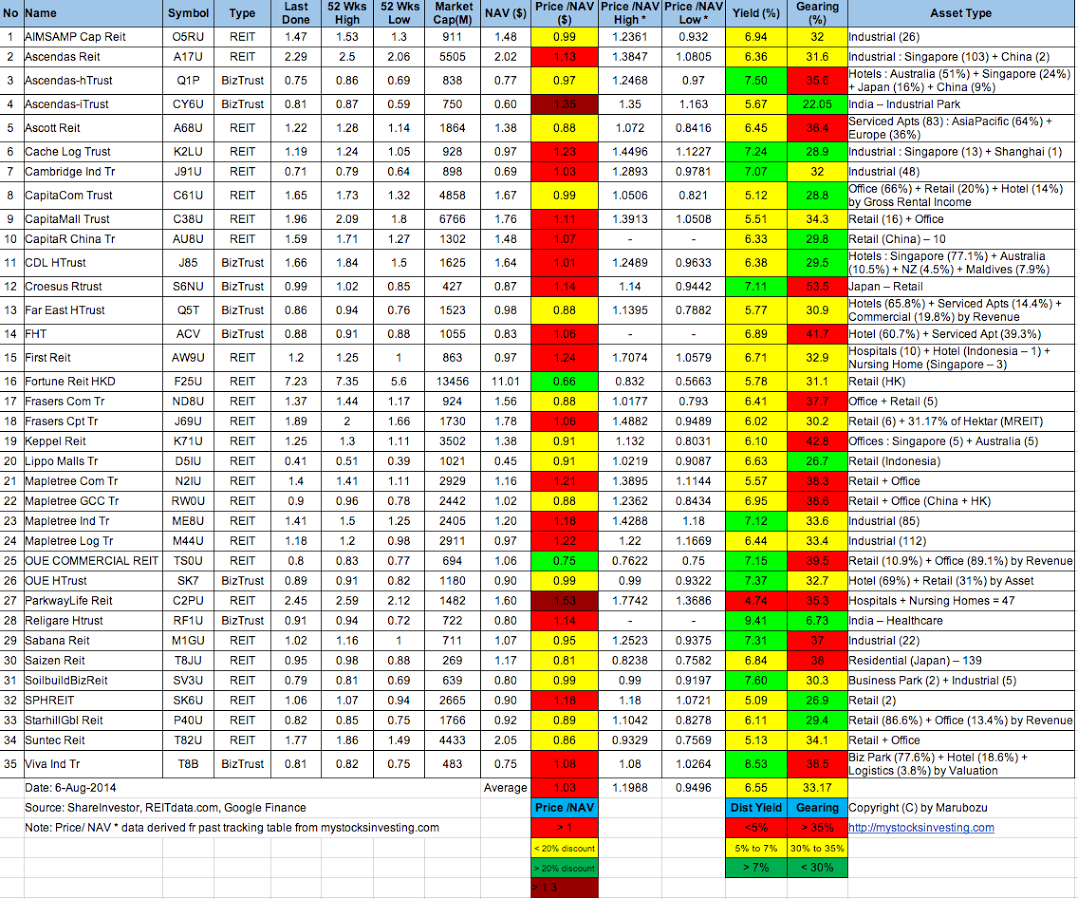
Bubble chart derived from Aug 7 Singapore REITs Fundamental Comparison Table.
These Bubble Charts are used to show the “relative” position compare to other Singapore REITs.
Two visual bubble charts to pick and avoid:
- Undervalue Singapore REITs with High Distribution Yield (Value Pick)
- Overvalue Singapore REITs with High Gearing Ratio (Risk Avoidance)
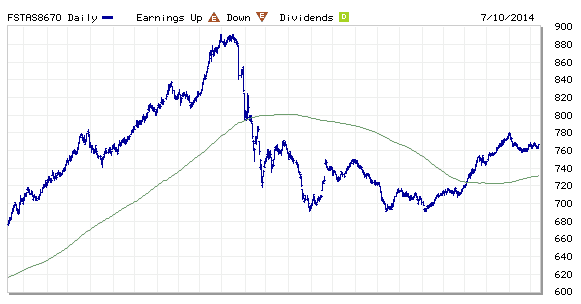
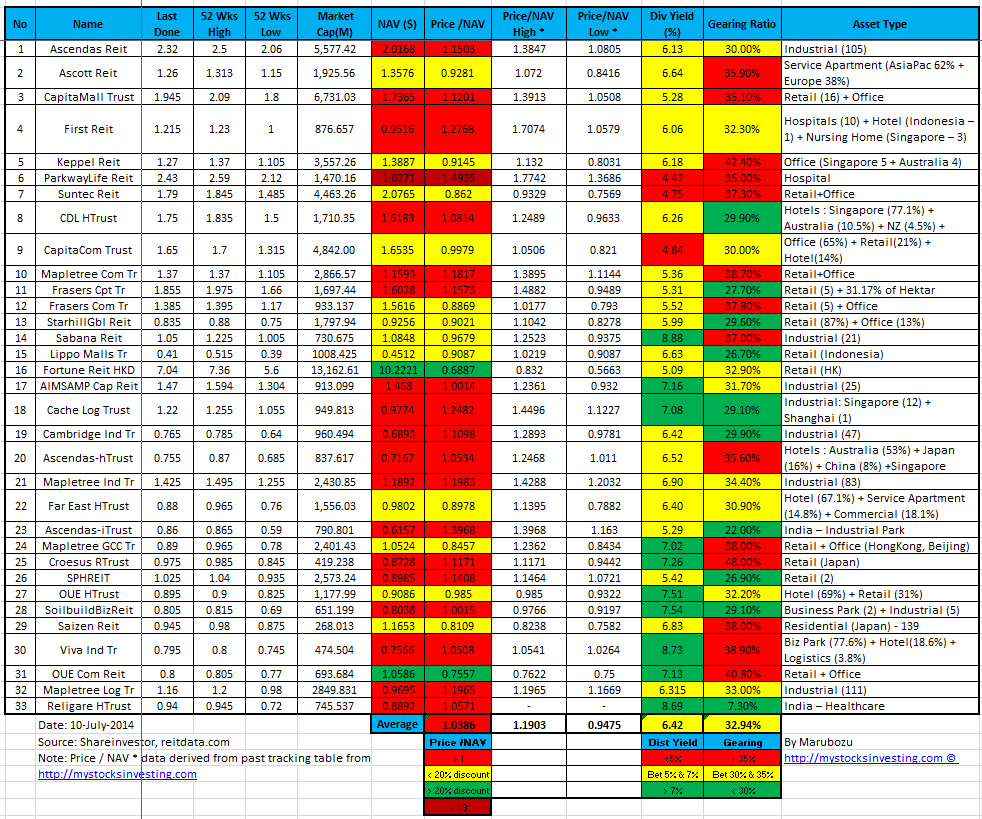
See last Singapore REIT Bubble Charts here to see the relative movement.