Why Most Investors Lose Money in Real Estate and Property Stocks in 2013?

  • Post author:

In general, your portfolio should have a lot of red (if you are still holding now) if you have invested in any property stocks (Capitaland, Keppel Land, City Development, UOL, etc) and REITs but did not hedge your portfolio with CFD.

So A-million dollar questions to most of the investors or traders in Singapore including myself:

  1. Is it the right time to pick up property stocks or REITs since the stock price has dropped so much?
  2. What should I do if I am still holding those property stocks and REITs? Should I cut loss or hold on and wait for the recovery?
  3. Is there any trading opportunity in property stocks?

Fundamentally the real estate / property sectors are hit by all the cooling measures and fear of interest hike due to QE tapering. I will not touch on the above 2 topics as there are already a lot of news and articles talking the impact to the property sectors in Singapore. I will be focusing in using technical analysis to analyse the overall trend for property sectors as a whole and individual stocks.

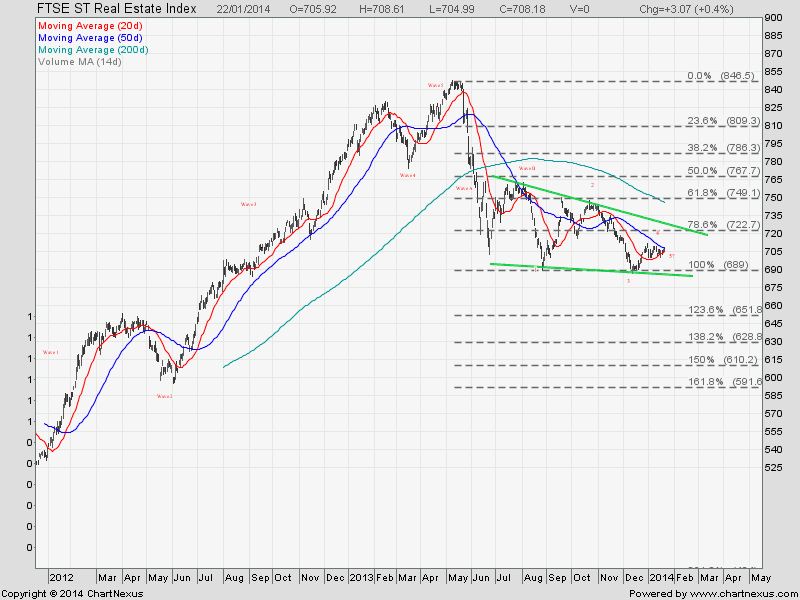
FTSE ST Real Estate Index

The index is trading in a Elliott Wave pattern and there is a possibility to start a Big Wave C down if break down from the Falling Wedge.

FTSE ST Real Estate Index Jan23-2014

FTSE ST Real Estate Investment Trust Index

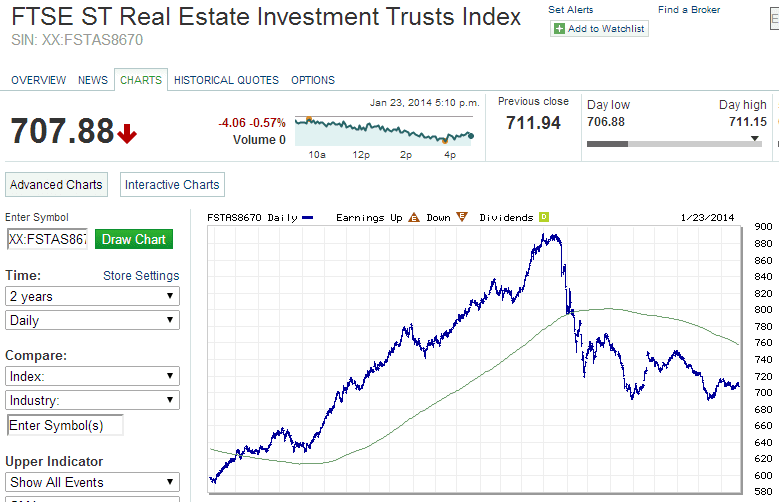
Singapore REITs is officially enter into bear trend after dropping more than 20% from the top.

The chart pattern is similar to FTSE ST Real Estate Index (Elliott Wave + Falling Wedge). More selling of the REIT is the support (about 690) of Falling wedge is broken.

FTSE ST Real Estate Investment Trust Index Jan23-2014

FTSE ST Real Estate Index Components Stocks

FTSE ST Real Estate Top 10 Companies Dec-2013

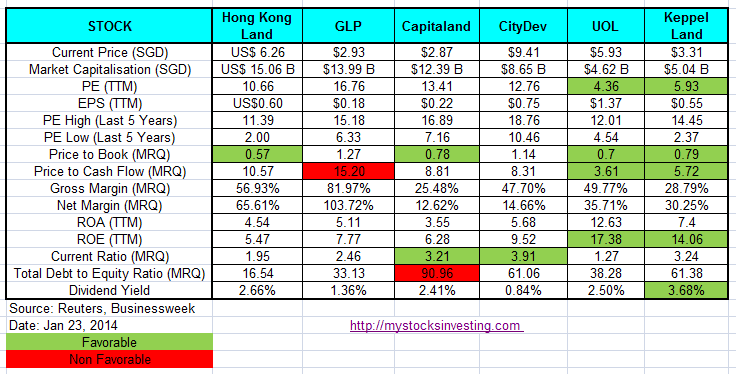
Fundamental Comparison for Key Component Stocks and Property Stocks

Property Stocks Fundamental Comparison Jan23-2014

Fundamental Comparison for Singapore REITs

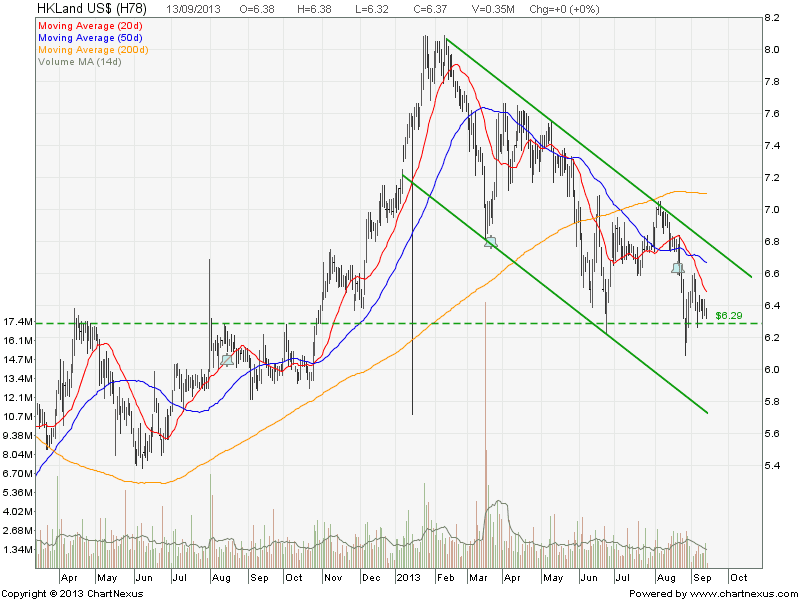
Hong Kong Land – Down Trend

HK Land Sept14-2013

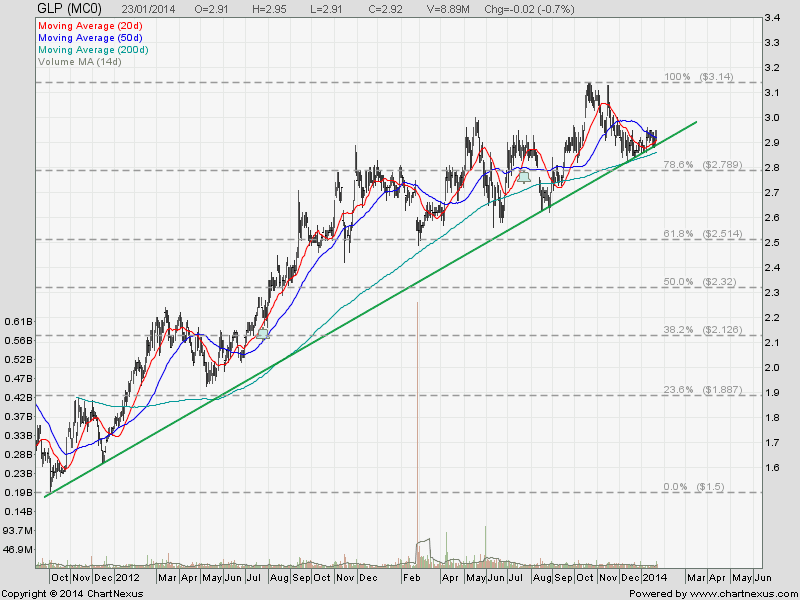
Global Logistic Properties (GLP) – Up Trend

2014Jan23-GLOBAL LOGISTIC PROP LIMITED-800x600

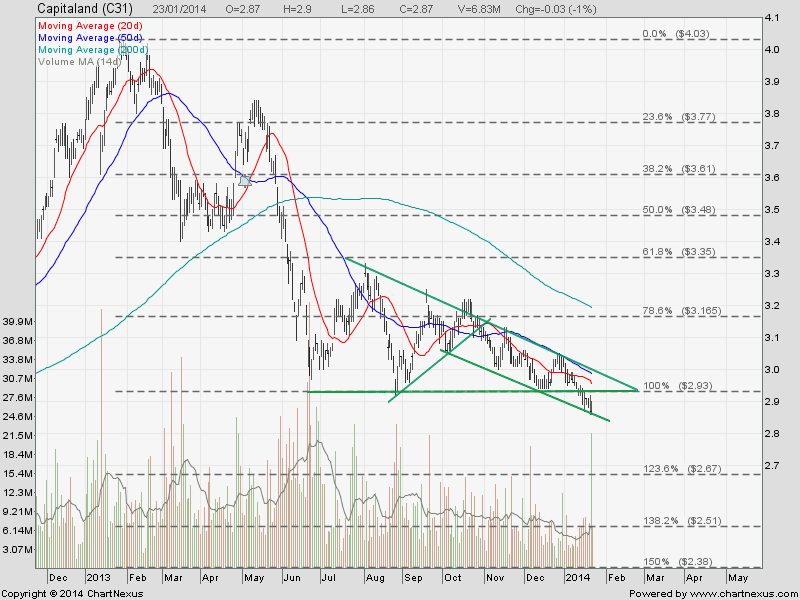
Capitaland – Break out from Descending Triangle. Continue Down Trend.

2014Jan23-Capitaland-800x600

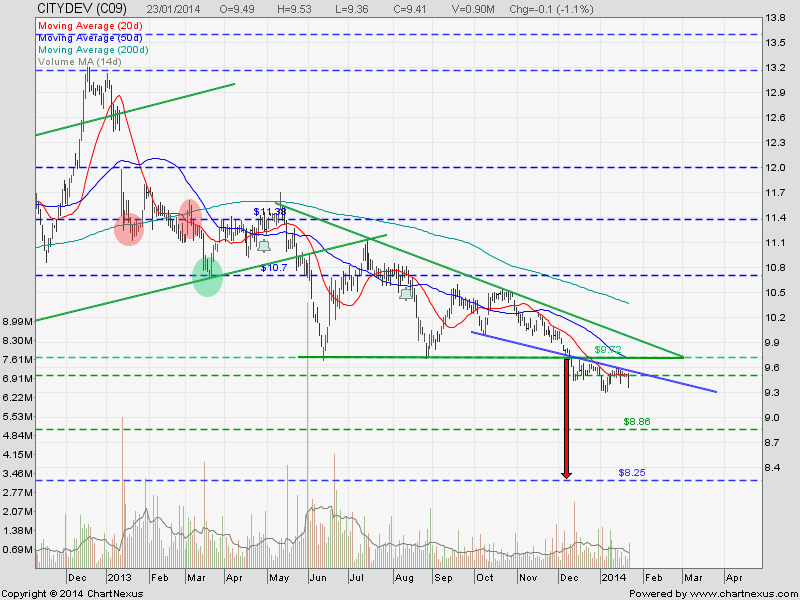
City Development – Break out from Descending Triangle. Continue Down Trend.

2014Jan23-CITYDEV-800x600

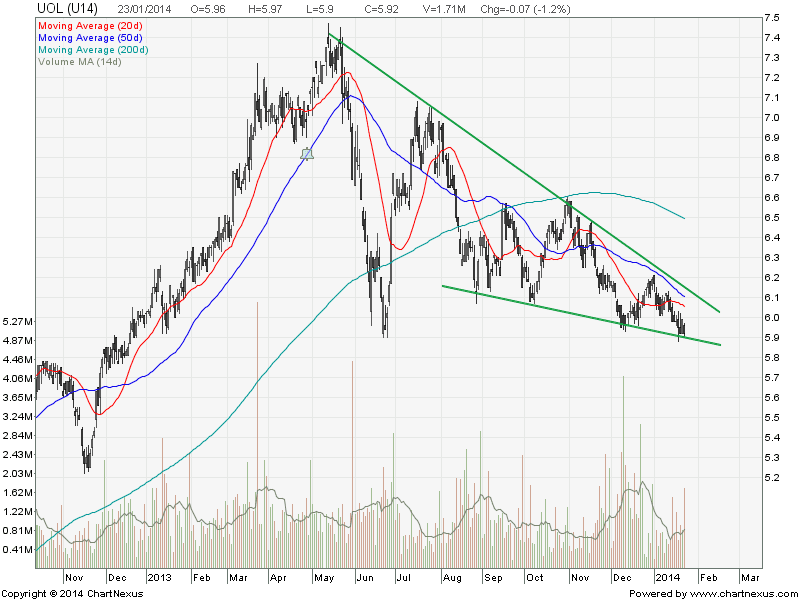
UOL Limited – Trading in a Falling Wedge.

UOL Jan23-2014

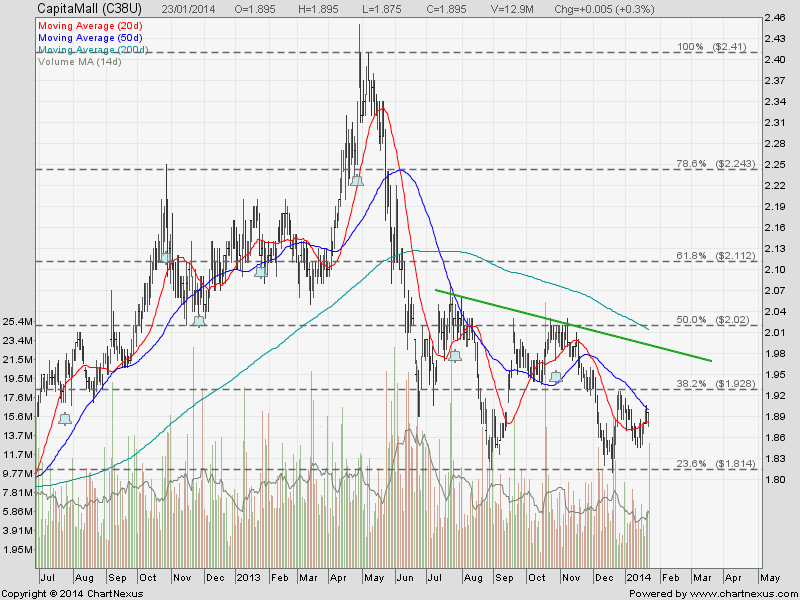
CapitaMall Trust – In consolidation.

2014Jan23-CapitaMall-800x600

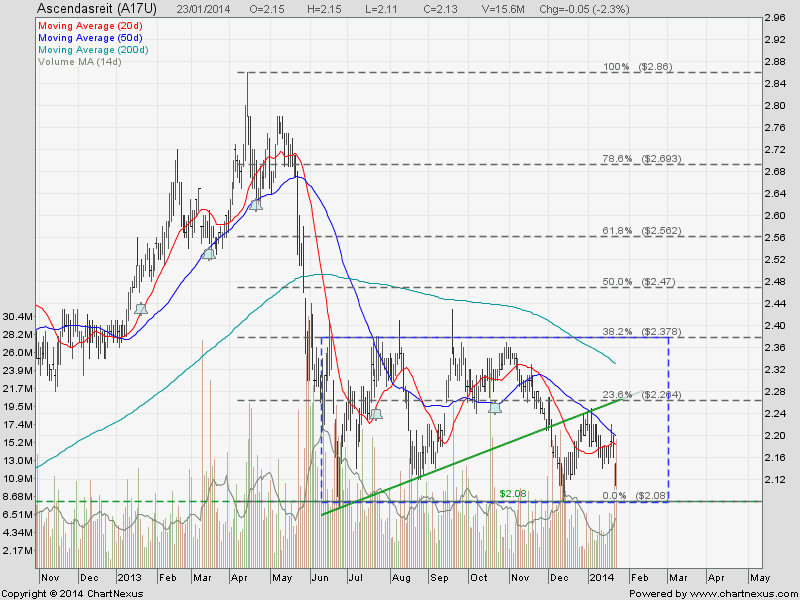
Ascendas REIT – Consolidation in Rectangle. Range Bound.

2014Jan23-Ascendasreit-800x600

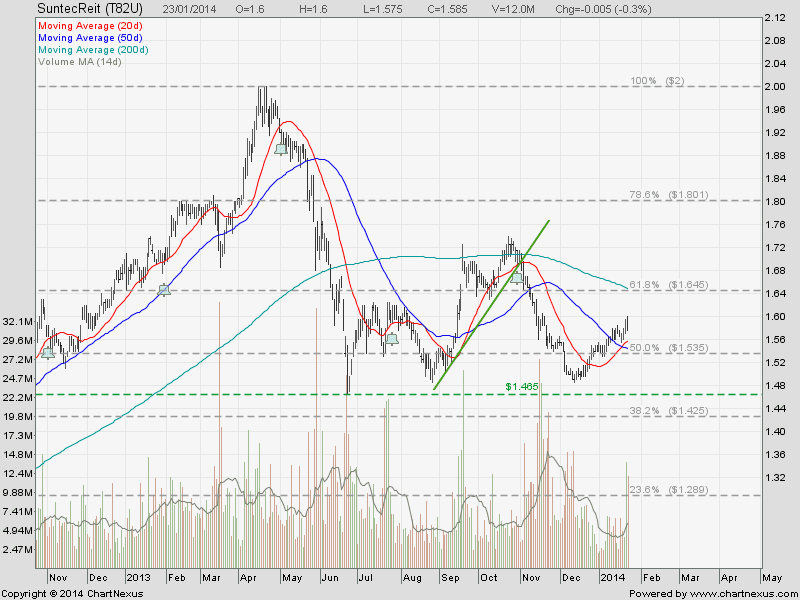
Suntec REIT – In consolidation.

2014Jan23 SuntecReit-800x600

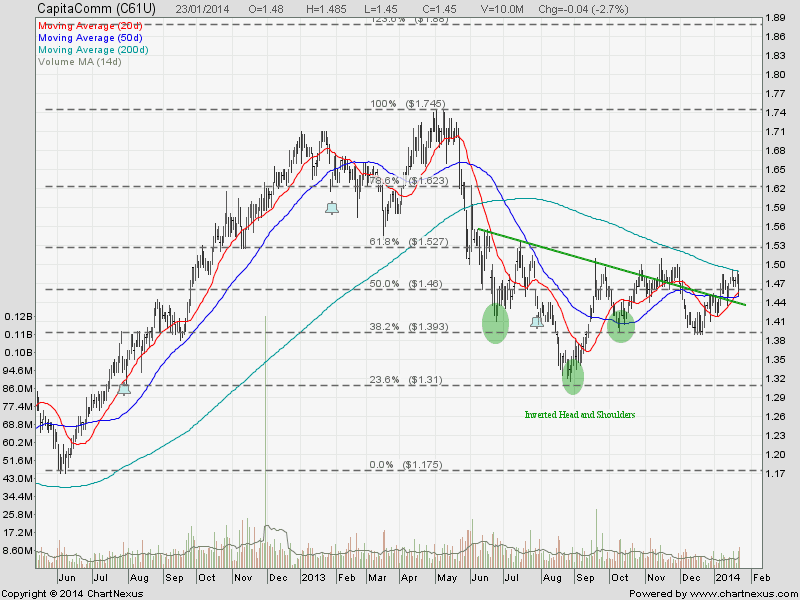
CapitaCommercial Trust – In consolidation.

2014Jan23-CapitaComm-800x600

Summary

Most of the property stocks and REITs either trading on down trend on in consolidation. Take note that the stocks are trading below 200D SMA (long term trend) which is sloping down (bearish signal). Base on the charts, this property and Real Estate sector have not found the bottom yet and probably will continue trading in a down trend in 2014. Bad news for investors who are still holding the stocks but good news for traders who know how to short the stock market. It will be a while for those smart investors who want undervalue stocks (Hong Kong Land, Capitaland, UOL, Keppel Land) to buy at bottom but need to keep a close eye on the chart.

Continue ReadingWhy Most Investors Lose Money in Real Estate and Property Stocks in 2013?

Is It Time to Invest in Singapore REIT to build up Passive Income?

  • Post author:

Debt Ceiling settled (at least for the time being), US Government re-opens, no sign of QE tapering yet, Dow Jones Industrial Index, S&P500, NASDAQ are recording historical high and still on the solid uptrend, Europe is coming out from recession, China and US GDP are doing well again….. so many good news, IS IT A GOOD TIME TO ENTER THE MARKET?

I received many inquiries regarding whether this is the right time to buy Singapore REIT. To tell you the truth: I do NOT know as I am not the fortune teller. No one can predict the direction of the stock market but it is important to understand the global economy and how those events can affect our investment plan and portfolio.

Besides looking at those Singapore REIT Fundamental data like NAV, Distribution Yield, Gearing Ratio, etc .. (See the Comparison Table for Singapore REIT here.), there are a few risks that we need to be aware as far as investing in Singapore REITs are concerned:

  • The hike of interest – The day will DEFINITELY come and the only question is when? REITs (Unit price and Distribution) will be hit because REIT has to pay more interest to the bond holders and banks due to the debt especially REITs with high gearing ratio. The hike of interest will double hit the REIT’s NAV and Distribution. 
  • REITs are sensitive to economy cycles. Any weakness in rental will affect the distribution income.
  • Currency risks for REITs which have the properties oversea.
  • REITs which high gearing may issue Rights to raise more fund to improve the working capital.

It is impossible for us to 100% understand what is happening in the world and how it will affect our REITs portfolio. However we can make better investment decision by analyse the charts using technical analysis. The charts will tell us when to invest or when to take profit / cut loss.

Base on the chart, FTSE ST Real Estate Investment Trust Index is still trading below 200D SMA (long term trend) but there is potential sign of reversal base on chart pattern. However, the upside potential is limited as long as the index stay below the 200D SMA.

FTSE ST REIT Index Oct18-2013


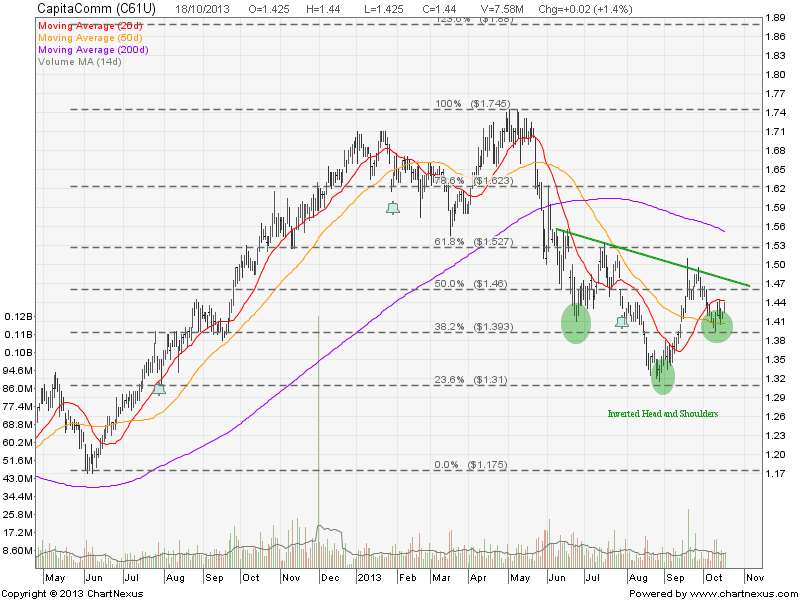
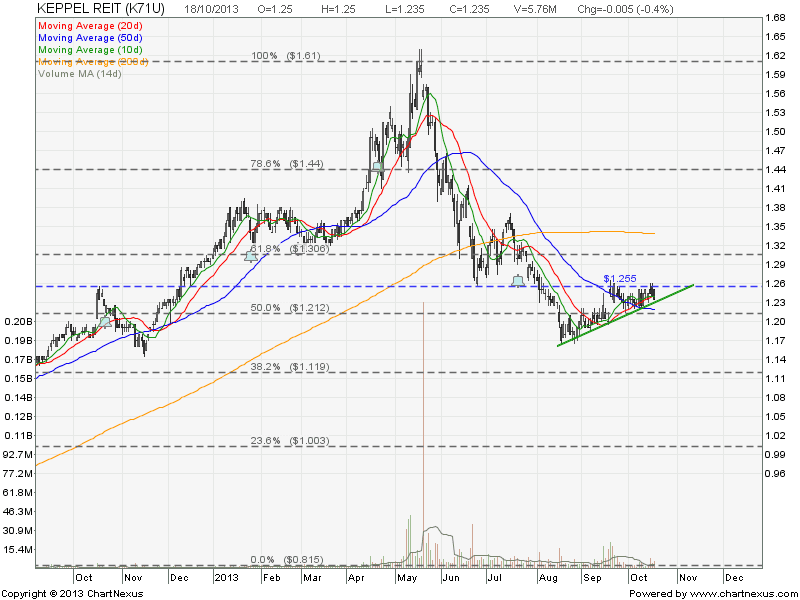
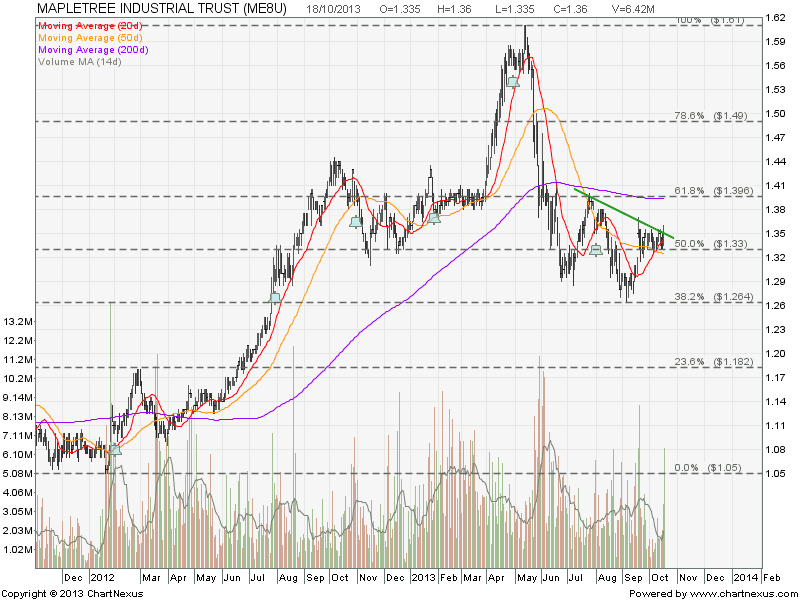
Similar chart patterns shown in the following REITs, all of them are in consolidation mode but upsides are limited.

Ascendas REIT

2013Oct20-Ascendasreit-800x600

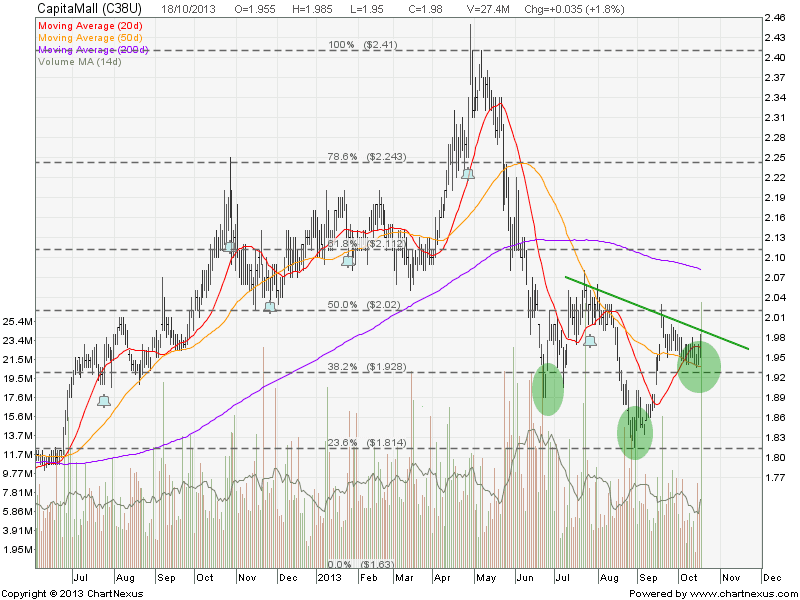
CapitaMall

2013Oct20-CapitaMall-800x600


CapitaComm

2013Oct20-CapitaComm-800x600

Keppel REIT

Keppel REIT Oct22-2013

Mapletree Comm

Mapletreecom REIT Oct20-2013

Mapletree Ind

Mapletree Ind REIT Oct20-2013

Suntec REIT

2013Oct20 SuntecReit-800x600


I will be sharing the Singapore REIT Fundamental Analysis, Technical Analysis and how the interest rate hike will impact your REIT investment in the coming public tutorial on  “How to pick Singapore REIT for Dividend Investing” . Sign up NOW as the seats are very limited due to the classroom size.

Continue ReadingIs It Time to Invest in Singapore REIT to build up Passive Income?

Is It A Good Time to Buy Singapore REIT Now?

  • Post author:

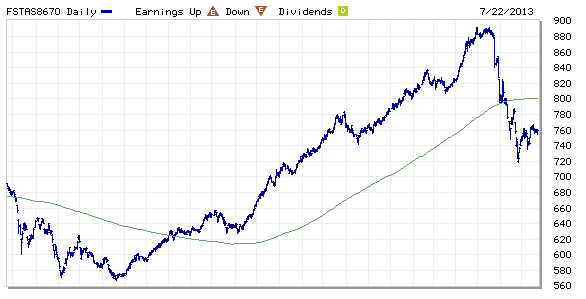
Singapore REIT has been beaten down badly for about 15% from the recent peak. See below chart of FTSE ST-REIT Index. The index is currently trading below 200D SMA (about 800) and the 200D SMA is trading flat.

FTSE ST REIT Index July22-2013

So, are the Singapore REITs cheap now? Is it the right time to pick up some REITs with high distribution yield? I am not going to tell you the answer because I am not the certified analyst and brokers and unable to make any Buy or Sell recommendation. I am going to put up all the facts and charts here for reference to give me an overview of current situation for my investing decision making.

See Singapore REIT comparison tables for Fundamental Analysis. In general, most of Singapore REITs are still over value. Let’s look at the charts of some Singapore REITs with large market capitalization.

CapitaMall (S$7.02B, S$2.03)

2013Jul22-CapitaMall-800x600

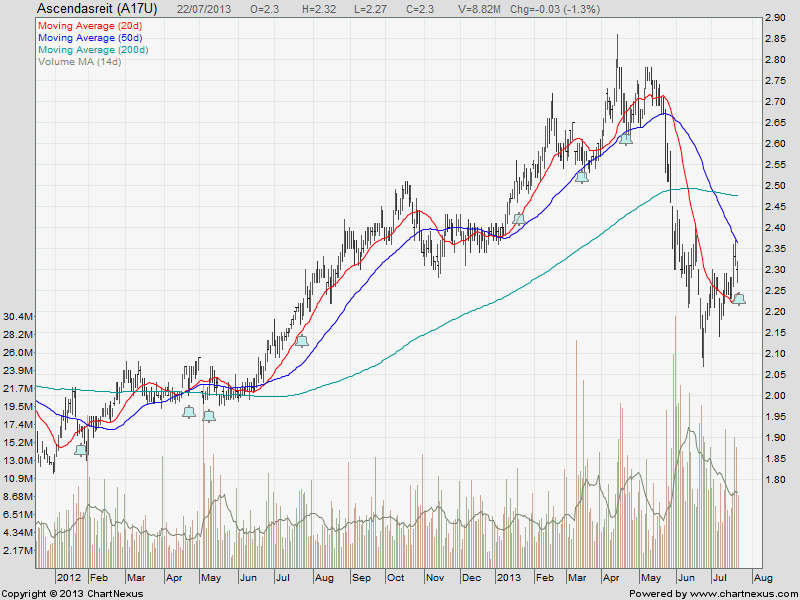
Ascendas REIT (S$5.52B, S$2.30)

2013Jul22-Ascendasreit-800x600

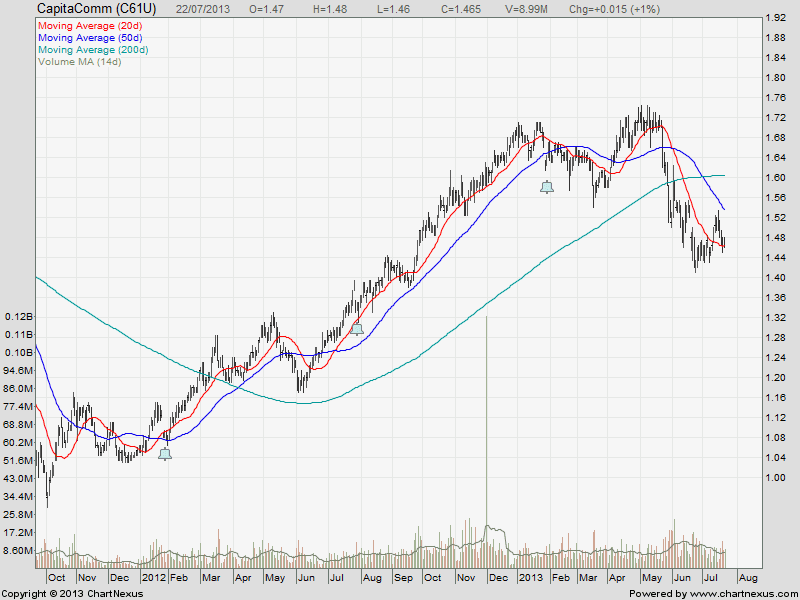
CapitaComm (S$4.2B, S$1.465)

2013Jul22-CapitaComm-800x600

Suntec REIT (S$3.54B, S$1.57)

2013Jul22 SuntecReit-800x600

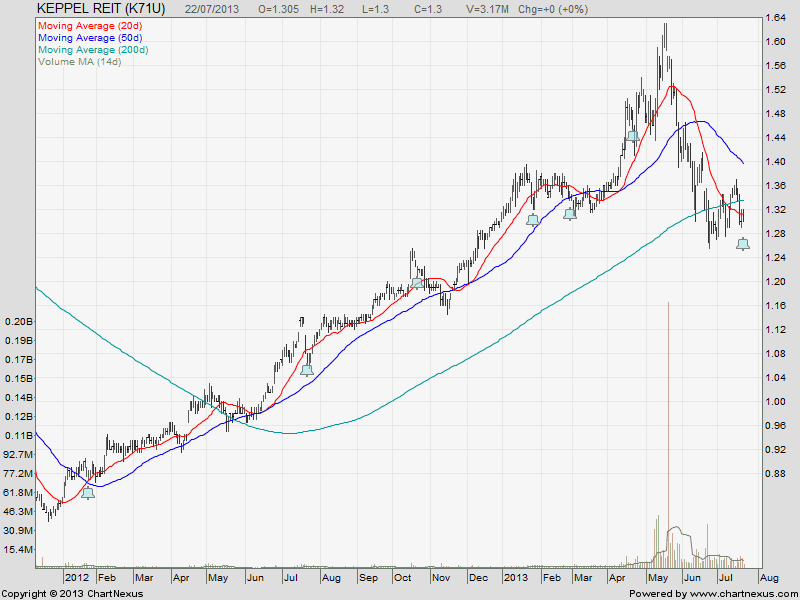
Keppel REIT (S$3.49B, S$1.30)

Keppel REIT July22-2013

MapletreeCom (S$2.53B, S$1.225)

Mapletreecom REIT

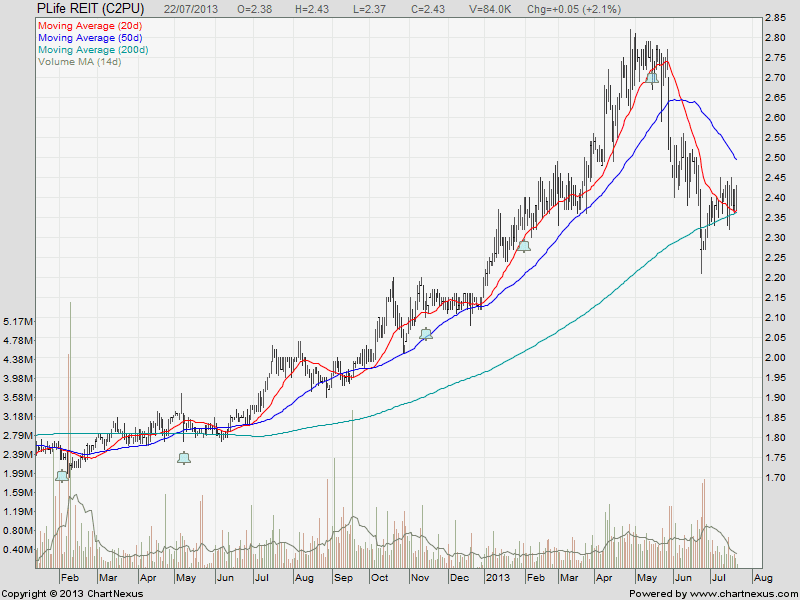
PLife REIT (S$1.47B, S$2.43)

PLife REIT Jul22-2013

In Summary base on the above charts, clearly the REITs are NOT trading in an uptrend. Some of them have broken 200D SMA and the charts are technically bearish. This means that the REIT prices can go even lower despite the current distribution yield looks attractive.

Check out How to Combine Fundamental & Technical Analysis to analyse Singapore REIT here.

Continue ReadingIs It A Good Time to Buy Singapore REIT Now?