
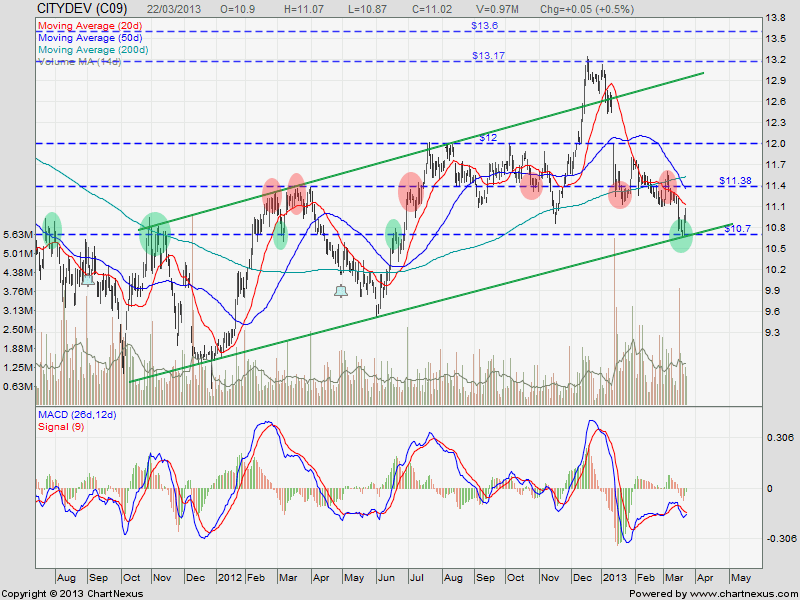
City Development: Rebound!
City Development rebound with a Bullish Engulfing (and Three Outside Up) candlestick pattern at the uptrend channel support at about $10.70. This $10.70 is a reliable resistance turned support level. The next significant level is support turned resistance at about $11.38. Current City Development chart represents a good opportunity for a short term bullish trade. This is also a good example that “Chart Pattern + Support / Resistance + Candlestick” is a much better trading strategy compare to the technical indicators like moving averages, MACD, Parabolic SAR, Bollinger Band, etc. These technical indicators still have not shown any bullish signals yet because they are lagging indicators.

 4_11_2012 - 8_21_2012")
 Week 51_2011 - Week 34_2012")