CSE Global – Elliott Wave B ?

  • Post author:

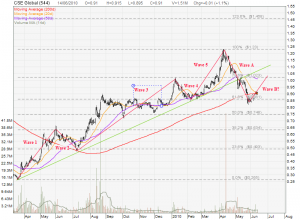
CSE Global is showing a Elliott Wave chart pattern. It looks like starting of a Elliott Wave B after finding a support at $0.86 which is a 61.8% Fibonacci Retracement Level. Currently CSE Global is testing an immediate resistance at about $0.90 (20D and 200D MA). If this resistance is cleared, it is confirmed that Elliott Wave B is formed and the next resistance is about $1.00 (50D MA and 78.6% Fibonacci Retracement Level). This $1.00 (or somewhere near the up trend support turned resistance) may be the starting point of Elliott Wave C.
Continue ReadingCSE Global – Elliott Wave B ?

CSE Global – Break the Up Trend Support

  • Post author:

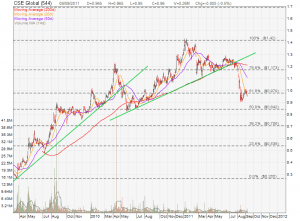
CSE Global has broken an up trend support and currently trading below 20D and 50D MA. The candlestick shows a potential formation of a Morning Star but need to wait for the confirmation of next trading day. Next immediate support is at $0.86 which is a 200D MA support and also 61.8% Fibonacci Retracement Level. The stock has to go above $1.00 to keep the up trend in tact.

Continue ReadingCSE Global – Break the Up Trend Support