DBS Bank: Huge Down Side Risk!

  • Post author:

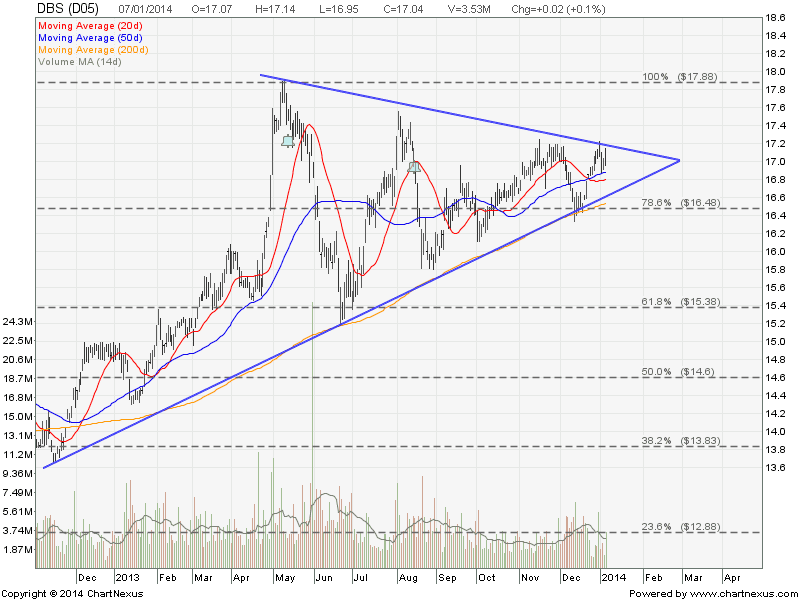
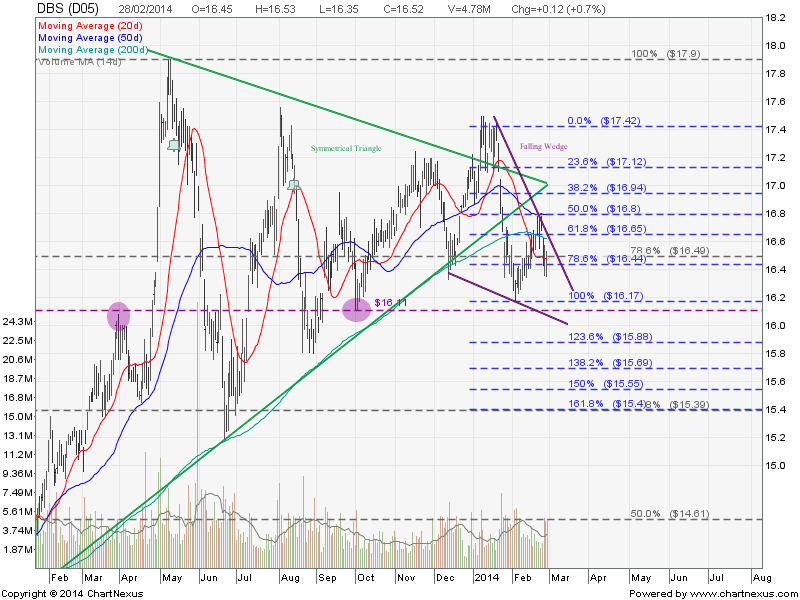
DBS is currently trading within a Falling wedge and trading below the 200D SMA. DBS retraced back to 50% Fibonacci Retracement and continue the downward movement to the price target of $15.40 (short term) and $14.40 (medium term base on the breakout from Symmetrical Triangle). Base on current chart pattern and technical analysis, the down side risk is very huge for DBS Bank. Good trading opportunities for shorting but bad for investors who do not know how to hedge. Sit tight!

Original Post by Marubozu @ My Stocks Investing Journey.

2014 Mar1-DBS


Join the Technical Analysis Workshop to learn how to derive the target price of the chart pattern of Symmetrical Triangle, Falling Wedge and using Fibonacci Retracement, to increase the probability of winning in your trade.


Continue ReadingDBS Bank: Huge Down Side Risk!

DBS Bank: Trading in a Symmetrical Triangle

  • Post author:

DBS Bank is currently trading in a Symmetrical Triangle and testing the Triangle resistance. DBS will be trading within the range of $16.50 and $17.20 until a breakout.

2014 Jan7-DBS

Original post by Marubozu @ My Stocks Investing Journey.

Current P/E Ratio (ttm) 10.6062
Estimated P/E(12/2013) 11.7033
Relative P/E vs. FSSTI 0.7975
Earnings Per Share (SGD) (ttm) 1.6066
Est. EPS (SGD) (12/2013) 1.4560
Est. PEG Ratio 2.3290
Market Cap (M SGD) 41,667.63
Shares Outstanding (M) 2,445.28
30 Day Average Volume 3,316,467
Price/Book (mrq) 1.2855
Price/Sale (ttm) 3.6677
Dividend Indicated Gross Yield 3.29%
Cash Dividend (SGD) 0.2800
Dividend Ex-Date 08/15/2013
5 Year Dividend Growth -4.08%
Next Earnings Announcement 02/06/2014


Continue ReadingDBS Bank: Trading in a Symmetrical Triangle