Ezra Holding: At Critical Support
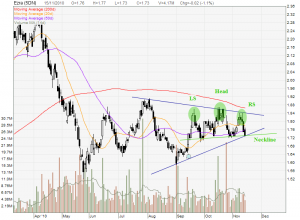
Ezra Holding has been trading within a range from $1.60 to $1.85 for 8 months. There is an intermediate support at about $1.75 between these two levels. Ezra is currently testing this intermediate support (which is also a 50D MA). If this support is broken, next immediate support is at $1.65 followed by $1.60. If this pattern repeats by itself, you can make some handsome money by buying near the support and sell near the resistance.
- Current Ezra PE = 13.1 (stock price = $1.71)
- Rolling PE = 14.6
- FY09 PE = 12.6
- FY08 = 5.6
- FY07 = 13
Currently Ezra is at its fair value base on current PE & rolling PE. Base on current analysis, Ezra is suitable for trading but not for investing. Note: 200D MA a long term trend line is sloping down!
However, majority of broker firms have a BUY recommendation base on Ezra future Earning potential & Forward PE.


