FIRST REIT: Watch the 200D SMA Support

  • Post author:

First REIT is one of the very few REITs in Singapore still trading above 200D SMA support. Can First REIT escape the current REIT sector sell off? Watch the 200D SMA support closely. By the way, this Healthcare REIT has formed a  “Lower Low, Lower High” down trend channel pattern.

2015Aug17-FirstREIT

See previous post on FIRST REIT here.

Singapore REIT Fundamental Analysis Comparison Table.

Continue ReadingFIRST REIT: Watch the 200D SMA Support

FIRST REIT: Breakout and Go Higher?

  • Post author:

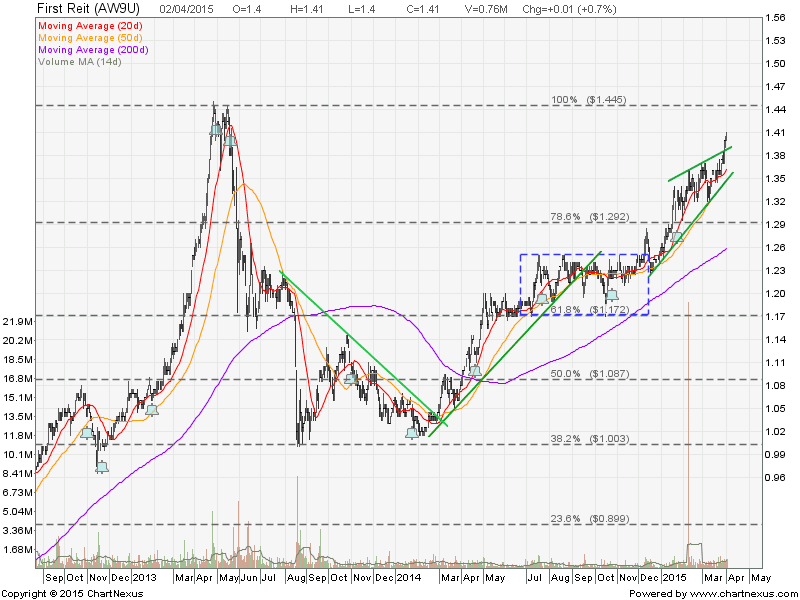
FIRST REIT looks like continue its uptrend after breaking out from the Rising Wedge. However FIRST REIT is getting near to the historical high and it is over value base on NAV.

2015Apri2-FirstREIT-800x600

  • Last Done Price = $1.41
  • Price /  NAV = 1.38 (38% Premium)
  • Price /  NAV (High) = 1.707
  • Price /  NAV (Low) = 1.058
  • Distribution Yield = 5.71%
  • Gearing Ratio = 33.1%

Previous Fundamental Analysis of FIRST REIT.

Singapore REIT Data Comparison Table.

Continue ReadingFIRST REIT: Breakout and Go Higher?

FIRST REIT: Consolidating in a Rectangle

  • Post author:

FIRST REIT is currently trading sideway in a Rectangle chart pattern.

2014Nov21-FirstREIT-800x600

  • Fundamentally FIRST REIT looks great.
  • FIRST REIT Valuation overvalue. Price/NAV High = 1.7, Price/NAV = 1.05
  • Technically FIRST REIT on long term uptrend (200D SMA is still trending up) but in consolidating mode currently.
  • 200D SMA support, Rectangle support and 61.8% Fibonacci Retracement support at $1.17. A good entry level if the support holds.

See Singapore REIT Fundamental Analysis comparison table here.


Continue ReadingFIRST REIT: Consolidating in a Rectangle