FIRST REIT: Under Watchlist

  • Post author:

Fundamental Analysis of FIRST REIT:

FIRST REIT Q12014 WADE FIRST REIT Q12014 WALE

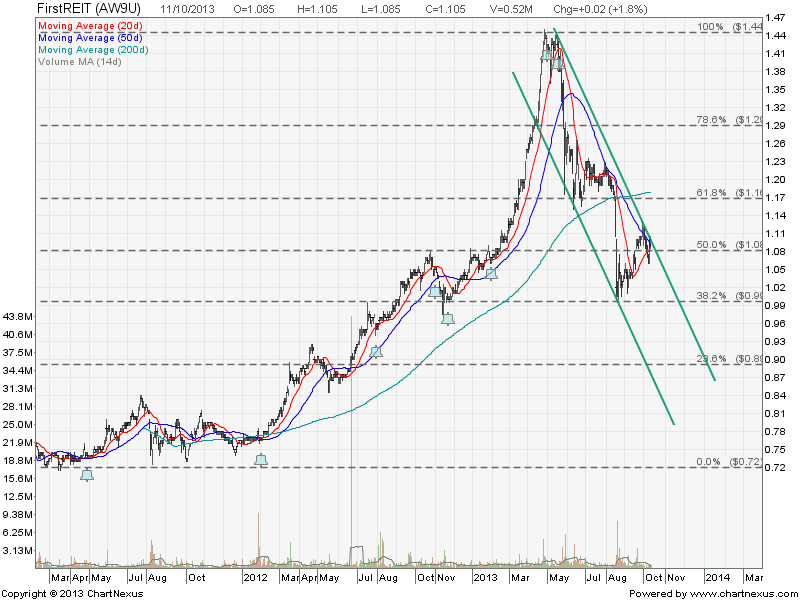
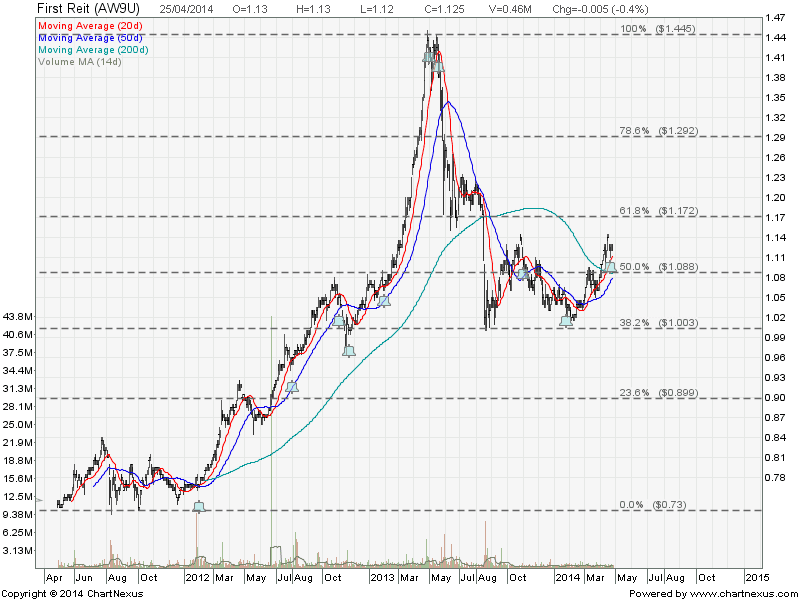
Frasers Centrepoint Trust may have bottomed up. As long as FIRST REIT stay above the 200D SMA support, there is a high probability this is the start of up trend. Watch out for the potential formation of Rectangle with resistance at $1.14 and support $1.00.

2014April25-FirstREIT-800x600


Compare with other Singapore REITs to find Good Value and Lower Risks Singapore REITs, in terms of distribution yield and gearing ratio at the current price.

If you want to invest in Singapore REIT to generate passive income but do not understand my analysis, you may want to check out my Singapore REIT Investing public workshop here. It is better and safer to invest in the knowledge first before throwing the money into stock market by making the wrong decision to invest in the wrong timing and choosing the REIT which do not suit your risk appetite.

Continue ReadingFIRST REIT: Under Watchlist

First REIT: Fundamental & Technical Analysis

  • Post author:

Fundamental Analysis

  • Last Price = $1.105
  • NAV = $0.895
  • Price / NAV = 1.2346
  • Distribution Yield = 6.195%
  • Gearing Ratio = 33.4%
  • Plus Points: Rental pegged at SGD and USD & Long Master Lease.
  • Minus Point: Gearing at the high side.

FIRST REIT last presentation at Macquarie ASEAN Conference on Aug 28, 2013.

Technical Analysis

First REIT is technically bearish (below 200D SMA) and currently seems like trading within a down trend channel. Currently the stock price is testing the down trend channel resistance. If rejected at this resistance and break the recent support of $1.06, First REIT will continue the down trend.

2013Oct12-FirstREIT-800x600

See Singapore REIT Comparison Table here.

Continue ReadingFirst REIT: Fundamental & Technical Analysis

Singapore REITs Comparison Table for Dividend Investment – May 2013

  • Post author:

Marked BUBBLE in black! Amazingly people is willing to overpay > 70% of the value to invest in First REIT and Parkway Life REIT.

Singapore S-REIT stock comparison table 2May-2013

Compare to last month SREIT comparison table:

  • Price/NAV increases from 1.20 to 1.22
  • Dividend Yield drops from 5.34% to 4.97%
  • Gearing Ratio drops from 33.15% to 32.92%

First REIT chart shows Parabolic Curve.

First REIT May2-2013


Parkway REIT is at almost historical high.

Parkway REIT May2-2013


Doing Fundamental Analysis of Singapore REIT is relatively easier than stock. If you are interested to learn how to do research on Singapore REIT and also time the entry / exit by learning the simple Trend Analysis, you may want to check out my 1st public tutorial “How to pick Singapore REIT for Dividend Investing” .


Continue ReadingSingapore REITs Comparison Table for Dividend Investment – May 2013