Frasers Centrepoint Trust (FCT) Fundamental & Technical Analysis

  • Post author:


Frasers Centrepoint Trust Logo

Base on the Fraser Centrepoint Trust (FCT)  Q2-FY16 Earning Result on April 22, 2016.

  • Last Done Price = $1.95
  • Market Cap = $1.79 B
  • NAV = $1.91
  • Price /  NAV = 1.021 (2.1% Premium)
  • Price / NAV (High) = 1.49
  • Price / NAV (Low) = 0.95
  • Gearing Ratio = 28.3%
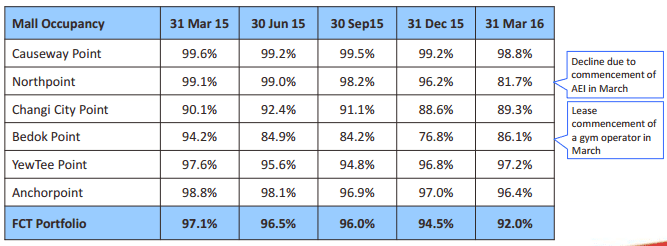
  • Occupancy Rate = 92.0%
  • WALE = 1.50 Years
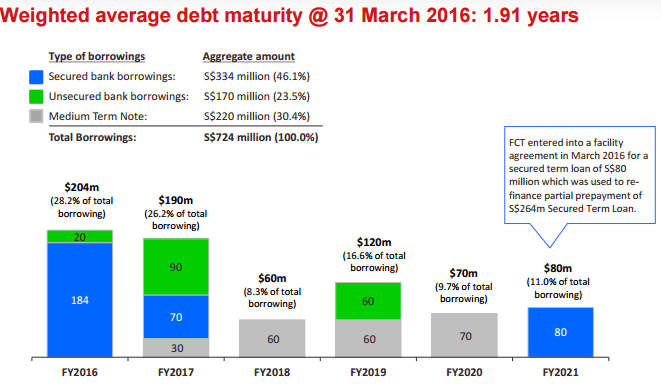
  • WADM = 1.91 Years

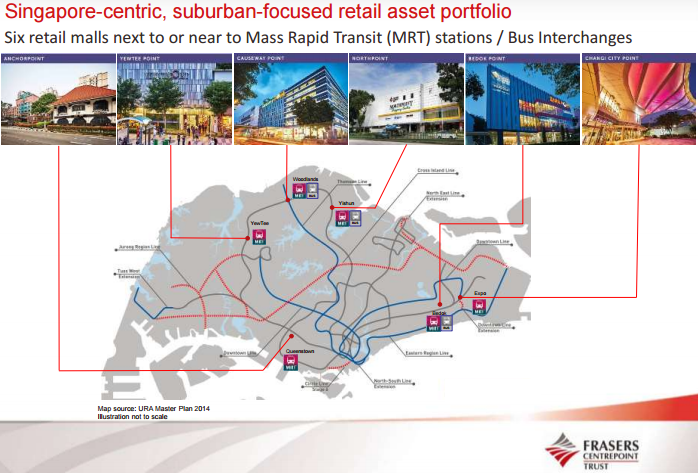
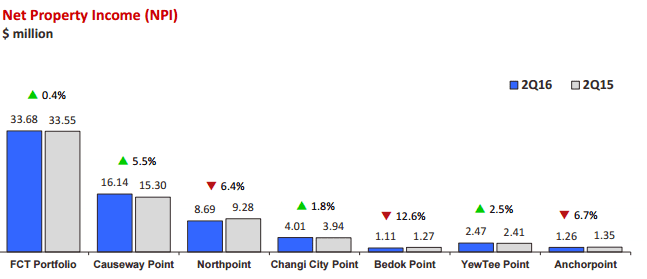
FCT DPU Trend April 22-2016 FCT Portfolio April 22-2016FCT NPI Contribution April22-2016 FCT NPI Contribution by Malls April22-2016FCT Occupancy April 22-2016FCT Diversification April 22-2016 FCT Top Ten Tenants April 22-2016FCT WALE April 22-2016FCT WADB April 22-2016FCT Sponsor Other Malls April 22-2016


Frasers Centrepoint Trust (FCT) Stock Chart and Technical Analysis

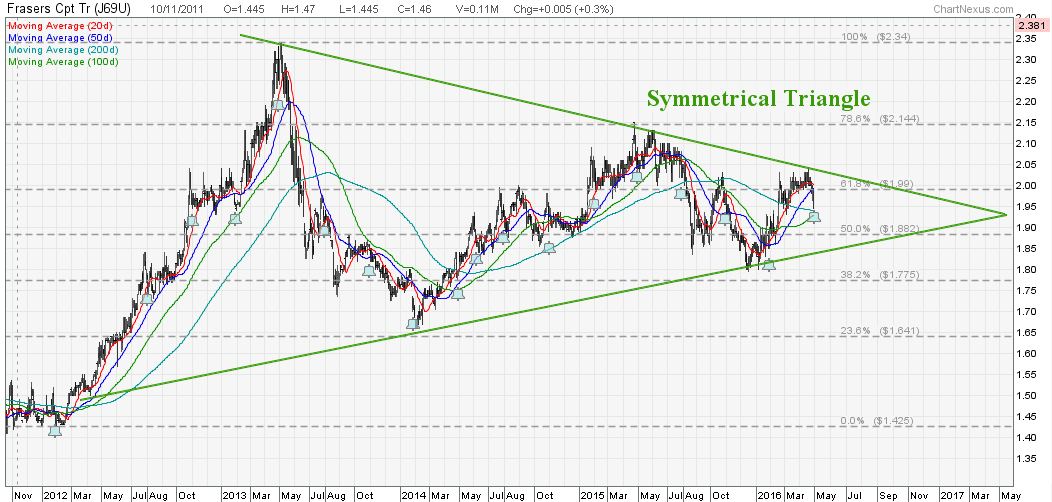
Frasers Centrepoint Trust April 29-2016

FCT is currently consolidating within a Symmetrical Triangle. Upside potential is limited and unlikely there will be any capital gain. FCT is a pure dividend stock for passive income at the moment.

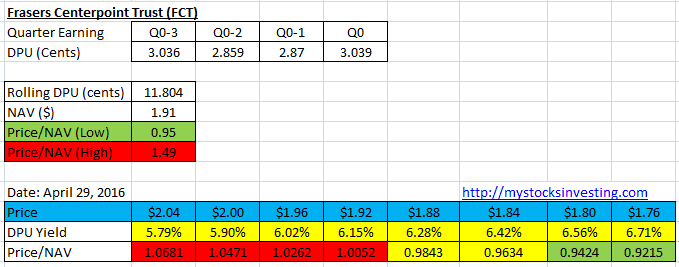
Yield and Price/NAV Simulation for Entry Planning

FCT  REIT Yield and NAV Simulation

I am combining Fundamental Analysis, Technical Analysis, Yield & Price/NAV simulation to determine a safe entry on my REIT investing to Maximize the Return, Protect Initial Capital and Minimize Losses. I will be sharing my REIT investing analysis techniques in my course. Check out the next Investing in Singapore REIT course here. This is a hands on course and focus on application.

Continue ReadingFrasers Centrepoint Trust (FCT) Fundamental & Technical Analysis

Frasers Centrepoint Trust: Bullish Breakout!

  • Post author:

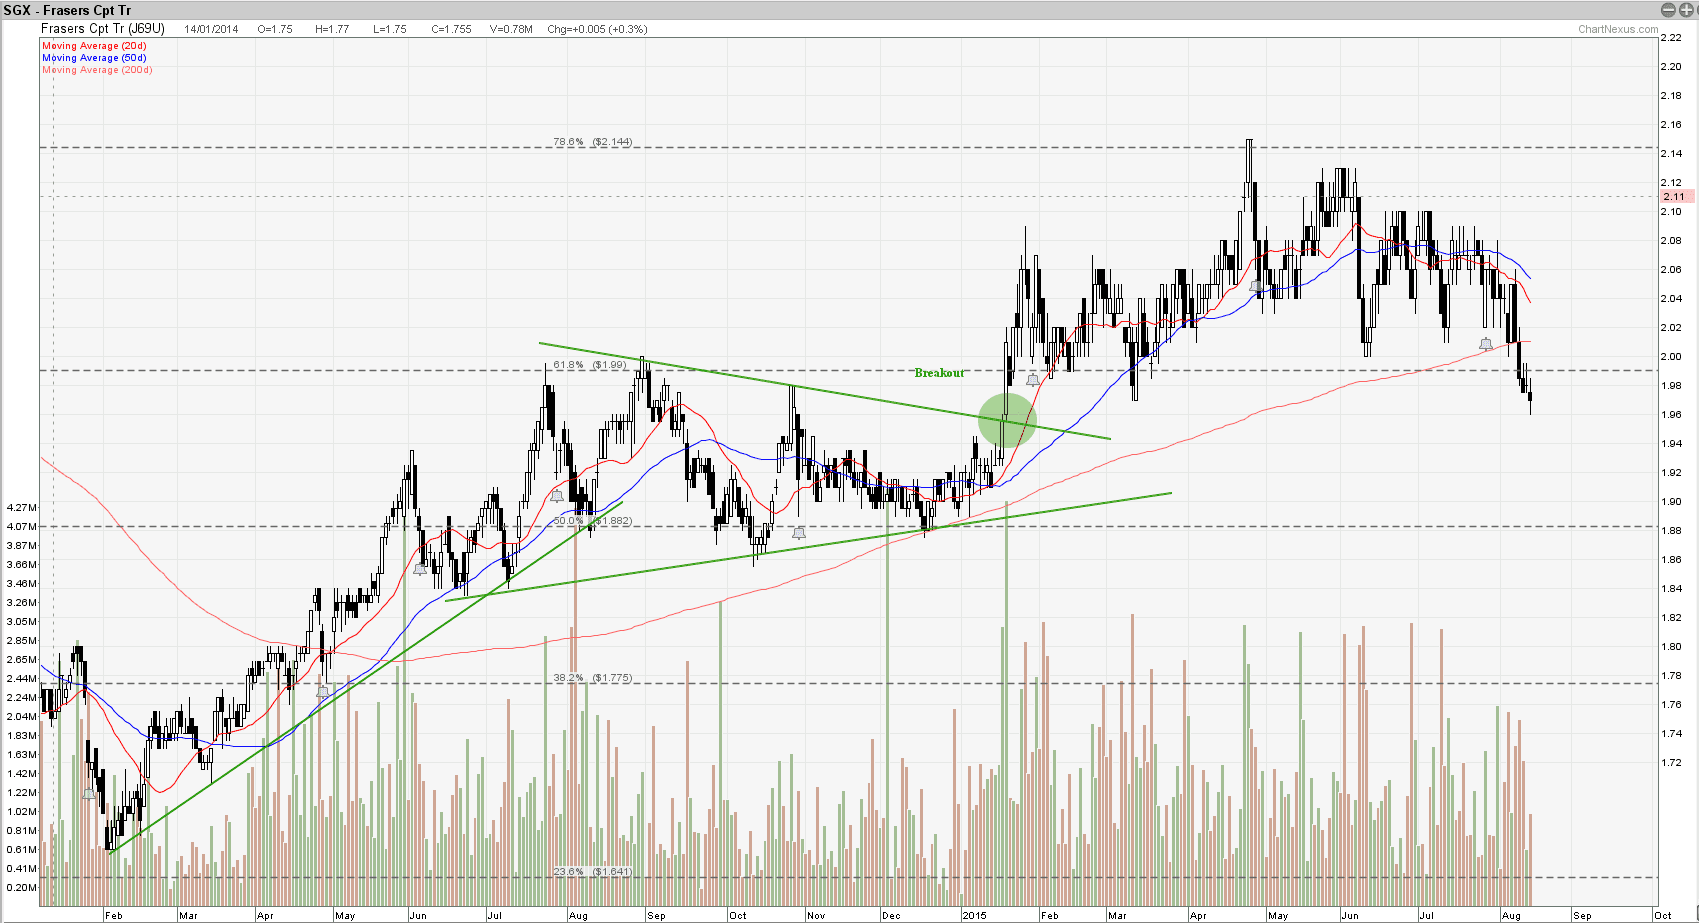
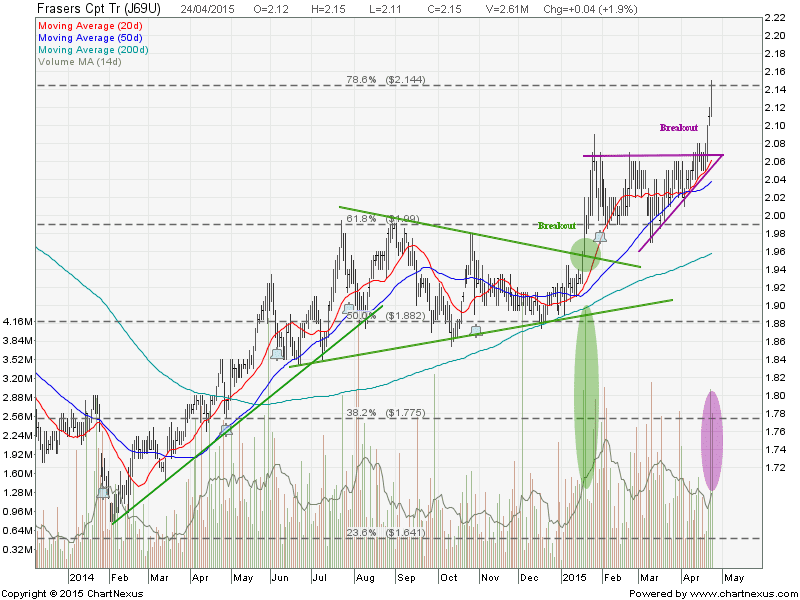
Frasers Centrepoint Trust breakout from an Ascending Triangle with spike in volume! The stock hit the breakout price target base on the Technical Analysis on Chart Pattern.

Frasers Centrepoint Trust April24-2015

  • Last Done Price = $2.15
  • NAV = $1.85
  • Price /  NAV = 1.16 (16% Premium)
  • Price /  NAV (High) = 1.488
  • Price /  NAV (Low) = 0.949
  • Distribution Yield = 5.35%
  • Gearing Ratio = 28.6%

Singapore REIT Data Comparison Table.

Continue ReadingFrasers Centrepoint Trust: Bullish Breakout!