Genting Singapore is getting very speculative recently as everyone is putting very high hope on Integrated Resorts and Casino. However, I am staying out of this stocks due to the following reasons:
(1) There is no fundamental to support the increase in the stock price. The company has been losing money for the past two year and expected to continue to make a loss this year.
(2) All future earnings of the company base on numerous assumptions. There are assumptions that the economy will recover as per plan, tourism will pick up in Singapore, the IR will be launched on time and have no delay, all revenues and profit are base on projection, etc. For those who have involved in drafting a business plan and doing a sales projection will know that everyone want to make the plan looks GREAT in front of the management and analysts, otherwise we will be challenged if the numbers do not meet the expectation. Very soon everyone will start to realise that the reality is very far away from plan, and the stock price will plunge!
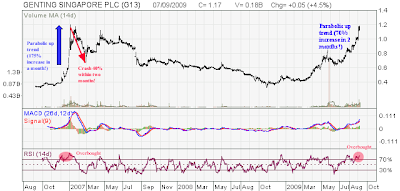
(3) Looking at the chart, the stock price climbs too fast and become a parabolic curve. This parabolic curve happened before in Dec 2007 where the stock price went up 175% in one month. Then the stock price crashed 40% back to $0.75 within two months. History always repeat itself, now the similar parabolic curve is seen again. The price has gone up 70% in two months (remember: WITHOUT any fundamental), we can predict what is going to happen next. In addition, there are many speculative professional traders in the game. Unless we as retail investors know what we are doing, it is better to stay out of this counter.
There are still many questions unanswered to convince me to buy this stock. What if the economy recovery is a L shape or W shape? What if another pandemic outbreak occur besides the bird flu and swine flu? What if there is another terrorist attack and everyone is scared of travelling? What if a war breaks out and causes the oil prices to shoot up 100% causes more expensive to travel? We just need ONE case to affect the future earnings of Genting and the stock price will plunge! I don’t see myself looking at this stock in the near future.


