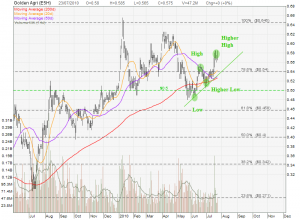
Current GoldenAgri chart suggests that a deeper correction may take place if the 200D MA support is broken.
A few bearish indicators shown in the chart:
- Price Volume Divergence. Although the stock price is rising but the volume is dropping, indicates the uptrend is not sustainable.
- Golden Agri is facing 50D MA resistance after the recent run up in the stock price. This 50D MA resistance is also a 78.6% Fibonacci Retracement Level. RSI & Stochastic are turning down to support a probable bounce down scenario.
- Golden Agri up trend support has been broken.
If the 200D MA support is broken, the next important support is at $0.458 (61.8% Fibonacci Retracement Level).


