HL Asia on Down Trend!

  • Post author:

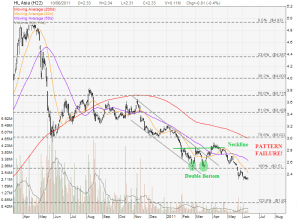
HL Asia has a Double Bottoms chart pattern failure. The stock was unable to break the neckline resistance and the stock price headed south since then. Currently HL Asia is trading below the 3 Moving Averages. Also take note that 200D MA (a long term trend) is sloping down which is a bearish sign.

Continue ReadingHL Asia on Down Trend!

Hong Leong Asia (HL Asia): Breakout from Double Bottoms?

  • Post author:

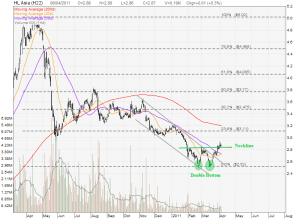
Hong Leong Asia or HL Asia just broke the neckline resistance of a Double Bottoms chart pattern after breaking the down trend channel (gray lines) resistance. The price target of the successful Double Bottoms Breakout is $3.16. This target is also the 200D MA resistance. Currently HL Asia may experience a pull back to the 20D/50D MA support at about $2.73. If this support is reliable, this is a good entry level to long this stock.

Continue ReadingHong Leong Asia (HL Asia): Breakout from Double Bottoms?

HL Asia: Down Trend Started?

  • Post author:

HL Asia failed to break the 50D MA resistance and also the 61.8% Fibonacci Resistance.  Current share looks bearish as the medium (50D MA) and long term (200D MA) trend is sloping down.

Rules of Thumb: Avoid to commit capital when the stock is on down trend although the stock price looks attractive (current PE at 9.1)

Continue ReadingHL Asia: Down Trend Started?