Jaya Holding – False breakout!

  • Post author:

Jaya had a false breakout (due to lack of volume) and moved back to the consolidation phase again.  The stock price is testing the 20D MA support line now and all other technical indicators are not showing any bullish signal. One thing to watch out whether the stock price can hold above the 20D MA support line. If it breaks this support line, I need to check Parabolic SAR & MACD to confirm whether it is a reversal of the trend.

Continue ReadingJaya Holding – False breakout!

Jaya Holding – breakout from consolidation and BULLISH!

  • Post author:

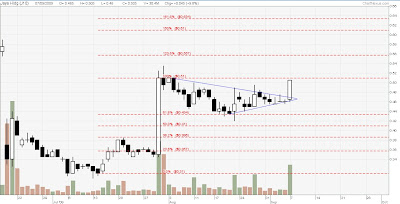
Jaya Holding breakout from consolidation today after one month with a closing marubozu candle. All Standard Six Technical indicators show bullish convergence.

  • Stock price above 20D, 50D and 200D MA.
  • Stock price above Parabolic SAR line
  • Stock price at the upper Bollinger Band.
  • MACD blue line cross red line at upper half.
  • RSI on up trend
  • Stochastic Blue over Red lines on up trend.

Immediate resistance is at $0.51 and next resistance is $0.635 (161.8% Fibonacci).

Continue ReadingJaya Holding – breakout from consolidation and BULLISH!