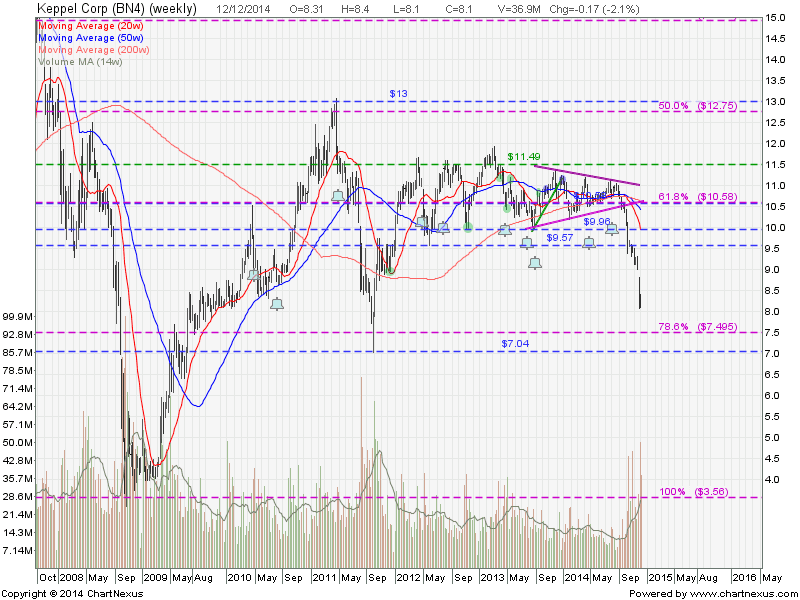
Keppel Corp: No Sight of Bottoming Yet
Keppel Corp is currently on a clear down trend and have no sign of bottoming yet. Not the right time to do bottom fishing yet for this blue chip which is listed on Singapore Stock Exchange and one of the component stocks of Straits Time Index (STI)
Original post by Marubozu from My Stocks Investing Journey.
| Current P/E Ratio (ttm) | 7.9490 |
|---|---|
| Estimated P/E(12/2014) | 9.4296 |
| Relative P/E vs. FSSTI | 0.5958 |
| Earnings Per Share (SGD) (ttm) | 1.0190 |
| Est. EPS (SGD) (12/2014) | 0.8590 |
| Est. PEG Ratio | 4.2380 |
| Market Cap (M SGD) | 14,713.87 |
| Shares Outstanding (M) | 1,816.53 |
| 30 Day Average Volume | 5,960,867 |
| Price/Book (mrq) | 1.4635 |
| Price/Sale (ttm) | 1.1330 |
| Dividend Indicated Gross Yield | 5.19% |
| Cash Dividend (SGD) | 0.1200 |
| Dividend Ex-Date | 07/31/2014 |
| 5 Year Dividend Growth | 5.12% |
| Next Earnings Announcement | 01/23/2015 |