OCBC Bank: Facing Resistance

  • Post author:

OCBC Bank Technical Analysis and Stock Chart.

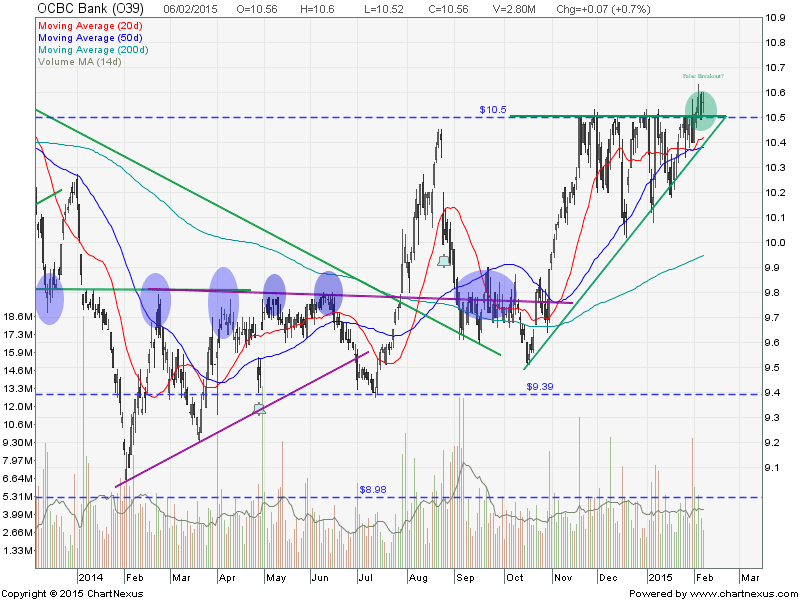
OCBC Bank is currently facing a channel resistance. Expect pull back at this level because MACD is weakening as well. Immediate support at $10.50 (20/50D SMA and also the previous resistance turned support level).

2015April10-OCBC Bk-800x600

Original post by Marubozu My Stocks Investing Journey.

Current P/E Ratio (ttm) 10.2170
Estimated P/E(12/2015) 11.1414
Relative P/E vs. FSSTI 0.7319
Earnings Per Share (SGD) (ttm) 1.0414
Est. EPS (SGD) (12/2015) 0.9550
Est. PEG Ratio 1.2154
Market Cap (M SGD) 42,363.69
Shares Outstanding (M) 3,981.55
30 Day Average Volume
Price/Book (mrq) 1.4272
Price/Sale (ttm) 3.5308
Dividend Indicated Gross Yield 3.34%
Cash Dividend (SGD) 0.1800
Dividend Ex-Date 04/30/2015
5 Year Dividend Growth 4.56%
Next Earnings Announcement 04/30/2015
Continue ReadingOCBC Bank: Facing Resistance

OCBC Bank: False Breakout?

  • Post author:

OCBC Bank has broken $10.50 resistance recently. This $10.50 resistance is also the Ascending Triangle resistance. If this is a real breakout, price target for OCBC Bank is about $11.10.  Take note that there is no spike in volume to support this breakout. Is this a successful breakout or a false breakout? We will only know the answer after the earning release on Feb 11.

Original post by Marubozu from My Stocks Investing Journey.

2015Feb6-OCBC Bk-800x600

Current P/E Ratio (ttm) 10.1169
Estimated P/E(12/2014) 11.1864
Relative P/E vs. FSSTI 0.6783
Earnings Per Share (SGD) (ttm) 1.0438
Est. EPS (SGD) (12/2014) 0.9440
Est. PEG Ratio 1.1150
Market Cap (M SGD) 42,065.89
Shares Outstanding (M) 3,983.51
30 Day Average Volume 4,300,717
Price/Book (mrq) 1.4624
Price/Sale (ttm) 3.5757
Dividend Indicated Gross Yield 3.22%
Cash Dividend (SGD) 0.1750
Dividend Ex-Date 08/25/2014
5 Year Dividend Growth 4.56%
Next Earnings Announcement 02/11/2015
Continue ReadingOCBC Bank: False Breakout?

Hedging Pair: UOB vs OCBC

  • Post author:

Establishing the correlation for UOB and OCBC as part of the Hedging Strategy for Singapore Stocks. Performance Charts with reference to Mar 9, 2009.

OCBC UOB Oct5-2014

Original Post by Marubozu My Stocks Investing Journey


UOB (United Overseas Bank)

2014Oct5-UOB-800x600

Current P/E Ratio (ttm) 11.8255
Estimated P/E(12/2014) 11.8542
Relative P/E vs. FSSTI 0.8722
Earnings Per Share (SGD) (ttm) 1.8976
Est. EPS (SGD) (12/2014) 1.8930
Est. PEG Ratio 1.5101
Market Cap (M SGD) 35,934.34
Shares Outstanding (M) 1,601.35
30 Day Average Volume 1,441,033
Price/Book (mrq) 1.2791
Price/Sale (ttm) 3.8184
Dividend Indicated Gross Yield 3.12%
Cash Dividend (SGD) 0.2000
Dividend Ex-Date 08/18/2014
5 Year Dividend Growth 4.56%
Next Earnings Announcement 10/30/2014

.

OCBC (Oversea-Chinese Banking Corp)

2014Oct5-OCBC Bk-800x600

Current P/E Ratio (ttm) 10.6491
Estimated P/E(12/2014) 11.0556
Relative P/E vs. FSSTI 0.7854
Earnings Per Share (SGD) (ttm) 0.9146
Est. EPS (SGD) (12/2014) 0.8810
Est. PEG Ratio 1.2353
Market Cap (M SGD) 38,272.55
Shares Outstanding (M) 3,929.42
30 Day Average Volume 5,418,767
Price/Book (mrq) 1.3712
Price/Sale (ttm) 3.5868
Dividend Indicated Gross Yield 3.49%
Cash Dividend (SGD) 0.1750
Dividend Ex-Date 08/25/2014
5 Year Dividend Growth 4.56%
Next Earnings Announcement 10/30/2014
Continue ReadingHedging Pair: UOB vs OCBC