Olam: Breakdown from Symmetrical Triangle

  • Post author:

Olam has started a down trend after breaking out from a Symmetrical Triangle with price target of $1.68. Olam support & resistance fit quite well to Fibonacci Retracement Level. It is too late to short at current level now (about $1.76). The plan is to wait for rebound to near to$1.83 (50% FR) or $1.90 level (61.8% FR) to short the stock again.

Continue ReadingOlam: Breakdown from Symmetrical Triangle

Olam: Drop below 20MA again!

  • Post author:

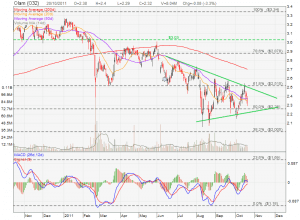
It is just a flash in the recent Olam’s rebound. After failing to test the wedge resistance at about $2.515 (also the 61.8% Fibonacci Resistance). Olam drops below 20D and 50D MA again. Need to watch whether Olam can still stay within this wedge when the stock price test the wedge resistance at about $2.20. If Olam breaks down from this wedge, the price target is $1.70.


Continue ReadingOlam: Drop below 20MA again!

Olam: Another Round of Roller Coaster Again!

  • Post author:

Olam has been very volatile in recent weeks swinging up and down. Base on current chart, Olam is facing a tough resistance at about $2.515 (which is the down trend resistance line, 50D MA resistance and also the 61.8% Fibonacci Resistance). Olam will be turning down if the share fails to break this resistance. There was a Deaisen (Bearish Meeting Lines) candlestick pattern, which is a reversal pattern, formed at 50D MA resistance which showed Olam has failed to break the resistance. Looks like $2.00 is the next possible price target in the coming weeks.

Continue ReadingOlam: Another Round of Roller Coaster Again!