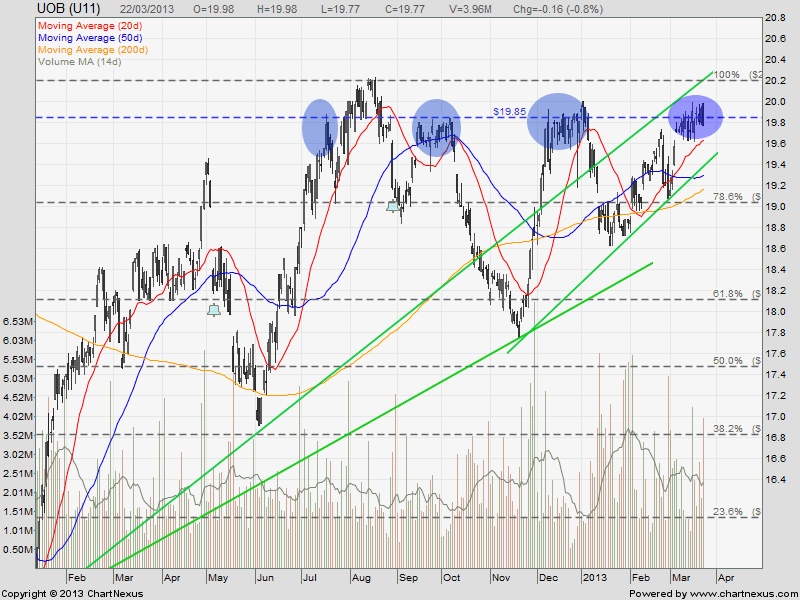
UOB rejected at $20.00 resistance with Bearish Engulfing pattern with a spike in trading volume. Is it a first sign of trend reversal? Anyway, I have shorted the stock using CFD base on my trading strategy “Buy Near Support, Sell Near Resistance” when I see a reversal candlestick pattern with a very tight stop loss just slightly above $20.00 resistance. All other technical indicators have not shown any bearish signals yet.
On a bigger scale, UOB is showing a Huge Ascending Triangle with a tough pyschological resistance at $20.00. 200D SMA support is at about $19.15.
Previous analysis on UOB Bank.
Key Statistics for UOB
| Current P/E Ratio (ttm) |
11.5109 |
| Estimated P/E(12/2013) |
11.6775 |
| Relative P/E vs. FSSTI |
1.0717 |
| Earnings Per Share (SGD) (ttm) |
1.7175 |
| Est. EPS (SGD) (12/2013) |
1.6930 |
| Est. PEG Ratio |
1.3011 |
| Market Cap (M SGD) |
31,134.76 |
| Shares Outstanding (M) |
1,574.85 |
| 30 Day Average Volume |
2,327,567 |
| Price/Book (mrq) |
1.3577 |
| Price/Sale (ttm) |
3.6342 |
| Dividend Indicated Gross Yield |
3.03% |
| Cash Dividend (SGD) |
0.1000 |
| Last Dividend |
05/06/2013 |
| 5 Year Dividend Growth |
-5.09% |
| Next Earnings Announcement |
05/09/2013 |