Frasers Centrepoint Trust (FCT) Fundamental & Technical Analysis
![]()
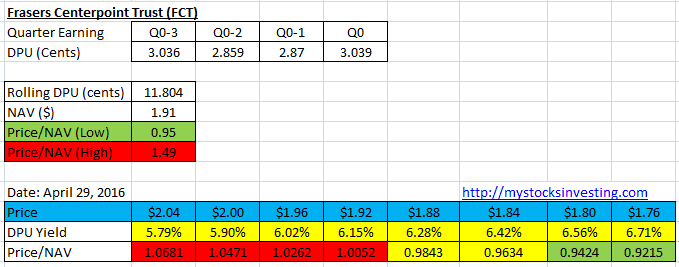
Base on the Fraser Centrepoint Trust (FCT) Q2-FY16 Earning Result on April 22, 2016.
- Last Done Price = $1.95
- Market Cap = $1.79 B
- NAV = $1.91
- Price / NAV = 1.021 (2.1% Premium)
- Price / NAV (High) = 1.49
- Price / NAV (Low) = 0.95
- Gearing Ratio = 28.3%
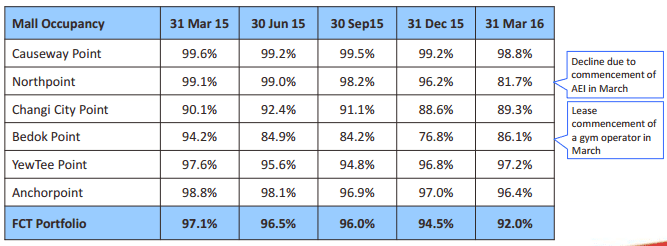
- Occupancy Rate = 92.0%
- WALE = 1.50 Years
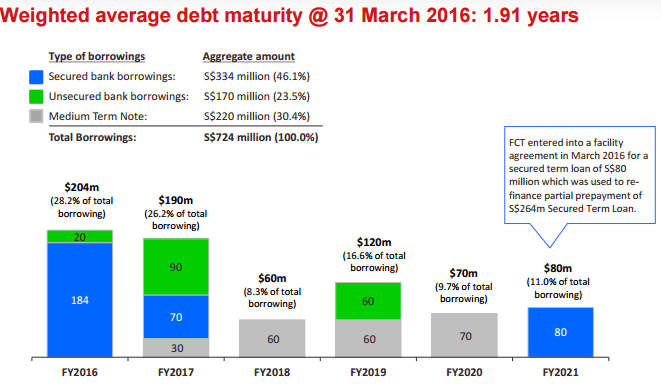
- WADM = 1.91 Years


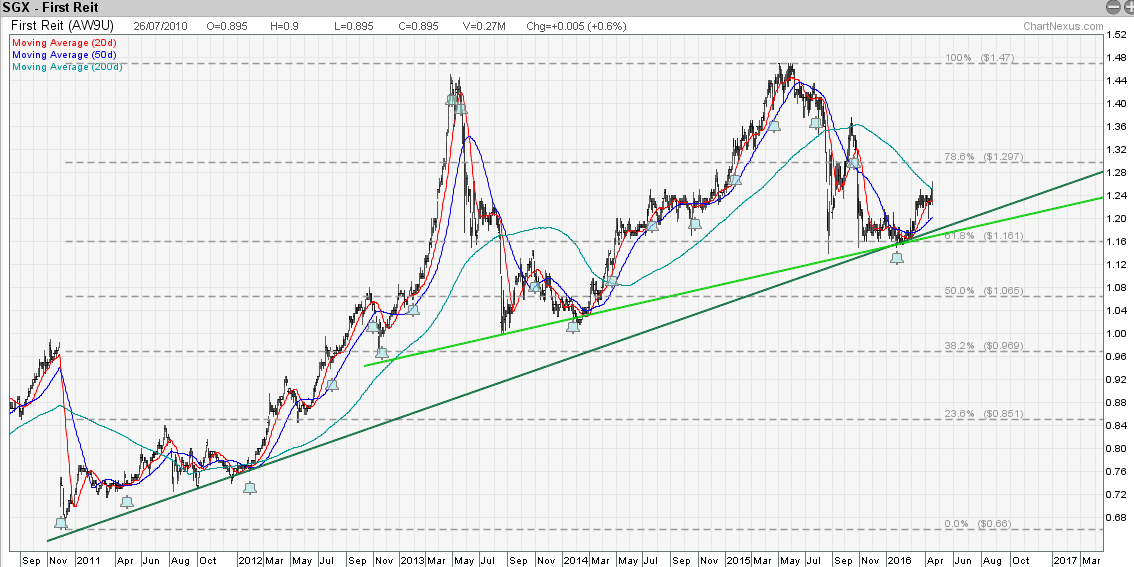
Frasers Centrepoint Trust (FCT) Stock Chart and Technical Analysis
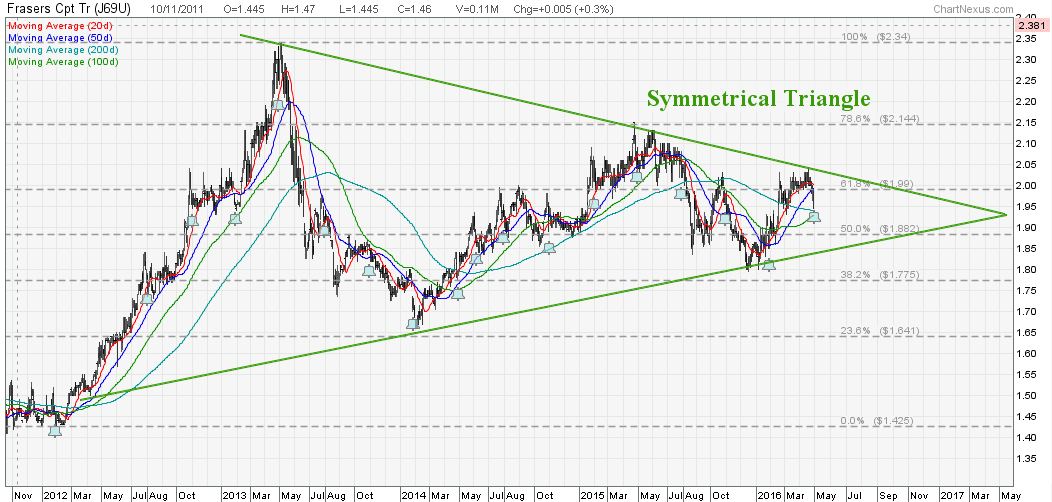
FCT is currently consolidating within a Symmetrical Triangle. Upside potential is limited and unlikely there will be any capital gain. FCT is a pure dividend stock for passive income at the moment.
Yield and Price/NAV Simulation for Entry Planning
I am combining Fundamental Analysis, Technical Analysis, Yield & Price/NAV simulation to determine a safe entry on my REIT investing to Maximize the Return, Protect Initial Capital and Minimize Losses. I will be sharing my REIT investing analysis techniques in my course. Check out the next Investing in Singapore REIT course here. This is a hands on course and focus on application.